





- What an Odoo dashboard actually requires, and why it usually becomes a project
- How an AI dashboard builder actually works
- Native Odoo reporting vs manual custom dashboards vs an AI dashboard builder
- Where an AI dashboard builder earns its keep day to day
- Getting the data right: accuracy, access, and governance
- Elsner’s AI Dashboard Builder: built for exactly this
- Getting started: a realistic rollout, not a weekend project
- The bottom line
- See AI Dashboard Builder in action
- Frequently Asked Questions
- What is an AI dashboard builder for Odoo?
- How is this different from Odoo’s native reporting?
- Do I need coding skills to use it?
- Is my business data shared with the AI provider?
- Can I build a dashboard from Excel or CSV data instead of Odoo data?
- Does this require Odoo Enterprise?
Every Odoo admin has lived some version of this: someone in leadership asks for a dashboard showing pipeline health, stock risk, or overdue invoices, and what should take twenty minutes turns into a week of pivot tables, a Studio ticket, or a call to a developer. The data was always in Odoo. Getting it into a chart that answers the actual question was the hard part.
That gap between having the data and seeing it clearly is what an AI dashboard builder is built to close. This guide covers what an Odoo dashboard actually requires today, how an AI dashboard builder works under the hood, where it holds up against native reporting and manual builds, and what to check before you roll one out across a team.
Quick Answer
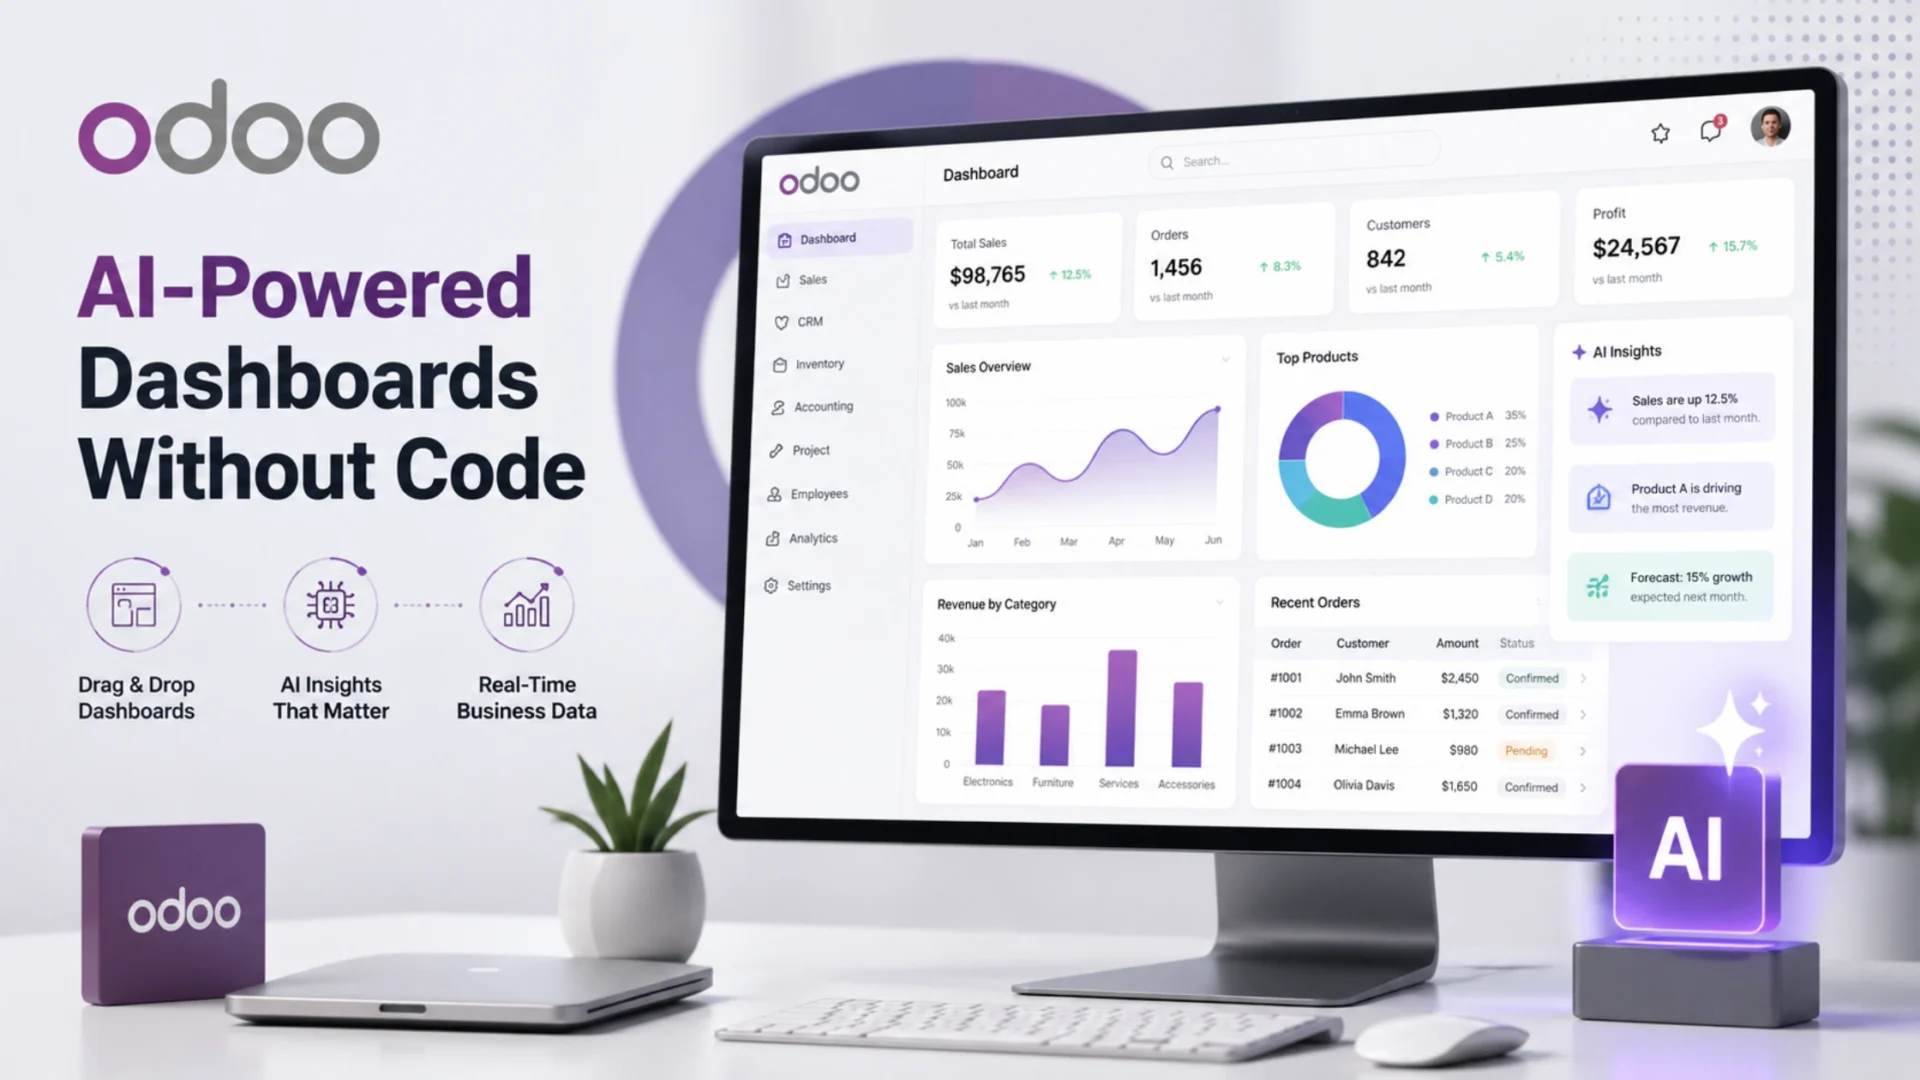
An Odoo dashboard becomes an AI dashboard when AI does the assembly work: point it at a model or an uploaded Excel or CSV file, describe what you want to track, and it generates KPI tiles, charts, and lists automatically. A well-built AI dashboard builder does this with schema-only data sharing, so record-level business data never leaves Odoo, while still supporting live refresh, drag-drop layout, and dozens of chart types.
What an Odoo dashboard actually requires, and why it usually becomes a project
Odoo’s built-in pivot views and graph views are genuinely useful for a quick look inside a single app. The trouble starts when someone wants a dashboard that pulls from more than one model, applies a specific filter set, updates automatically, and stays readable for people who are not going to open a pivot table themselves.
At that point, teams usually end up in one of two places. Either a developer builds a custom view through Odoo development work, which is solid but takes time and needs a change request every time the question changes. Or someone exports data to a spreadsheet and rebuilds the same chart by hand every reporting cycle, which works until the person who built it goes on leave.
Neither path is wrong. They are just slow for how often the underlying question actually changes. A sales manager rarely wants the exact same dashboard for more than a quarter before the next question comes up: which reps are slipping, which region is ahead, which deals are stuck. An AI dashboard builder is aimed squarely at that churn.
How an AI dashboard builder actually works
Three things happen behind a request like “build me a dashboard for overdue receivables by sales team.”
The data source can be any Odoo model directly, an uploaded Excel or CSV file, or both combined on the same chart, which matters for budgets, targets, or external numbers that do not live in Odoo.
The AI layer reads only the model and field schema, table names and field types, never actual records, and proposes a set of KPI tiles and charts that match the request. A well-built system shares that schema with the AI provider and nothing else; customer names, invoice amounts, and stock quantities stay inside Odoo.
The dashboard itself renders from local data, refreshing either in real time as records change or on a set interval, and stays editable afterward: group by, sort, filter, and chart type can all be adjusted without regenerating anything.
That separation, schema for the AI, records for the dashboard, is the part most people miss when they hear “AI generates a dashboard” and assume their business data is being sent somewhere. It is worth checking explicitly before adopting any AI dashboard generator, because not every vendor draws that line the same way.
Native Odoo reporting vs manual custom dashboards vs an AI dashboard builder
All three of these can produce a working dashboard. The real difference is how much they cost you every time the question changes.
| Approach | What it is | Best for |
|---|---|---|
| Native Odoo reporting | Built-in pivot and graph views inside each app | Quick, one-off checks inside a single model |
| Manual custom dashboard | A developer-built or Studio-built fixed layout | A stable, rarely-changing executive view |
| AI dashboard builder | AI-assembled, drag-drop dashboards from any model or file | Cross-model views that evolve as questions change |
Native reporting is not going anywhere, and it should not. It is the fastest option for a single quick answer. The moment a dashboard needs to combine models, live-refresh, and get rebuilt every few weeks as priorities shift, an AI dashboard builder removes the rebuild cost almost entirely, because changing the question is a prompt, not a change request.
Where an AI dashboard builder earns its keep day to day
Here is what this looks like once it is actually in use, not as a demo screen, but as something a team checks before a Monday meeting.
Sales pipeline reviews
A funnel chart of stage-by-stage conversion, grouped by rep, refreshed live as deals move. No exporting the CRM every Friday to rebuild the same view.
Inventory and stock health
A bullet chart comparing current stock against reorder targets by warehouse, with a map view showing where shortages are concentrated.
Finance and cash flow snapshots
Overdue receivables charted against a budget target uploaded from Excel, sitting alongside live accounting data on one board.
Support and helpdesk performance
Ticket volume by category and average resolution time, with a one-click explanation of any spike, without a support lead pulling numbers manually.
None of this replaces deeper financial or BI analysis. It replaces the recurring, low-value work of rebuilding the same charts by hand every time someone asks a slightly different version of the same question.
Getting the data right: accuracy, access, and governance
A dashboard that looks polished but shows the wrong numbers to the wrong people is worse than no dashboard at all. A few things deserve attention before rolling one out beyond a single desk.
Access tiers, not one shared view
A finance dashboard and a sales dashboard rarely belong to the same audience. Group-based visibility and separate admin, editor, and restricted access levels keep sensitive numbers away from people who do not need them.
Schema-only AI, verified not assumed
Confirm exactly what gets sent to the AI provider before turning on generation features. Field names and types are one thing; customer records and transaction amounts are another. These should never be the same data flow.
Scope the data source deliberately
A dashboard mixing live Odoo data with an Excel file from three months ago will look coherent and be wrong. Apply domain filters and date ranges consistently, and label uploaded files with the date they were last updated.
Choose refresh cadence on purpose
Real-time refresh is useful for operational boards people check hourly. A timed interval is usually the better choice for large datasets or executive summaries, so live updates do not add load for no real benefit.
Elsner’s AI Dashboard Builder: built for exactly this
Elsner Technologies published AI Dashboard Builder on the official Odoo Apps Store to take the rebuild cost out of dashboarding entirely, without asking teams to trust a vendor with data they cannot see the handling of.
- 17 visualization types, from KPI tiles and funnel charts to map views and bullet charts, switchable in one click without rebuilding the item.
- Schema-only AI generation across 8 supported providers, including OpenAI, Anthropic, and Google Gemini, or a self-hosted endpoint, with business records never leaving Odoo.
- Excel and CSV as data sources, combinable with live Odoo models on the same chart, for budgets, targets, and external figures.
- Drag-drop layout with real-time refresh via Odoo’s bus system or a timed interval, plus per-item Discuss chat for teams to debate a number where it lives.
- Three-tier access control with group-based visibility, and full export or import of dashboards as JSON for reuse across instances.
It ships with 10 ready-made demo dashboards across Sales, CRM, Accounting, and Inventory, so a team can customize an existing board instead of starting from a blank grid. For businesses that want the layout, governance, and access model configured around their specific Odoo setup, that kind of tailoring sits comfortably inside Elsner’s broader Odoo development work.
Getting started: a realistic rollout, not a weekend project
1. Install and start without AI turned on. Explore the demo dashboards and build a first board manually. Every layout, filter, and chart feature works without an API key connected.
2. Connect one AI provider and test on a low-stakes model. Generate a dashboard for something like a marketing list or internal project tracker first, so any surprises show up somewhere harmless.
3. Expand to sales, finance, and inventory once the pattern holds. Set access groups deliberately at this stage, and confirm refresh cadence and data scoping before sharing a board beyond the person who built it.
The bottom line
A good Odoo dashboard was never really about the chart. It was about how fast someone could go from a question to an answer, and how much that answer cost to keep updated. An AI dashboard builder does not replace judgment about what to track. It removes the rebuild tax every time the question changes.
Start without AI turned on, confirm exactly what data leaves the system before turning it on, and set access levels before a dashboard goes beyond one desk. Teams that get real value from this are not the ones with the most charts. They are the ones who trust the numbers on the screen.
See AI Dashboard Builder in action
Elsner Technologies built AI Dashboard Builder as a verified module on the official Odoo Apps Store. If your team wants real-time, AI-assisted dashboards from any Odoo model or spreadsheet, without writing a line of code, this is the module built for exactly that.
Frequently Asked Questions
What is an AI dashboard builder for Odoo?
An AI dashboard builder is a module that generates KPI tiles, charts, and lists from an Odoo model or an uploaded Excel or CSV file based on a plain-language description, instead of requiring a developer or manual pivot table setup for every new view.
How is this different from Odoo’s native reporting?
Native pivot and graph views work well inside a single model for a quick look. An AI dashboard builder combines multiple models or files on one board, refreshes live, and can be regenerated or adjusted in minutes as the underlying question changes.
Do I need coding skills to use it?
No. Dashboards are built through drag-drop layout, menu-based filters, and AI generation prompts. Every layout and chart feature also works manually without any AI provider connected.
Is my business data shared with the AI provider?
In a schema-only setup, only model and field structure, table and field names and types, is sent to the AI provider. Customer records, amounts, and other business data stay inside Odoo and are used only to render the finished chart.
Can I build a dashboard from Excel or CSV data instead of Odoo data?
Yes. Excel and CSV files can be uploaded and charted on their own or combined with live Odoo data on the same dashboard, which is useful for budgets, targets, or figures that do not live inside Odoo.
Does this require Odoo Enterprise?
No. AI Dashboard Builder is available for Odoo Online, Odoo.sh, and On Premise installations, though module compatibility should always be checked against the specific Odoo version in use.