- What are GA4 Advance Metrics?
- The GA4 Revolution
- Shopify
- WordPress
- GA4 Exploration
- Advanced Real-Time View
- Enhanced Measurement
- Channel Groups
- Retention Report
- Admin Panel Options
- Customize Reports
- Data Filter
- Setup Assistant
- Custom Definitions
- Data Display Options
- Events & Conversion, Audiences, Reporting Identity
- Search Console Integration
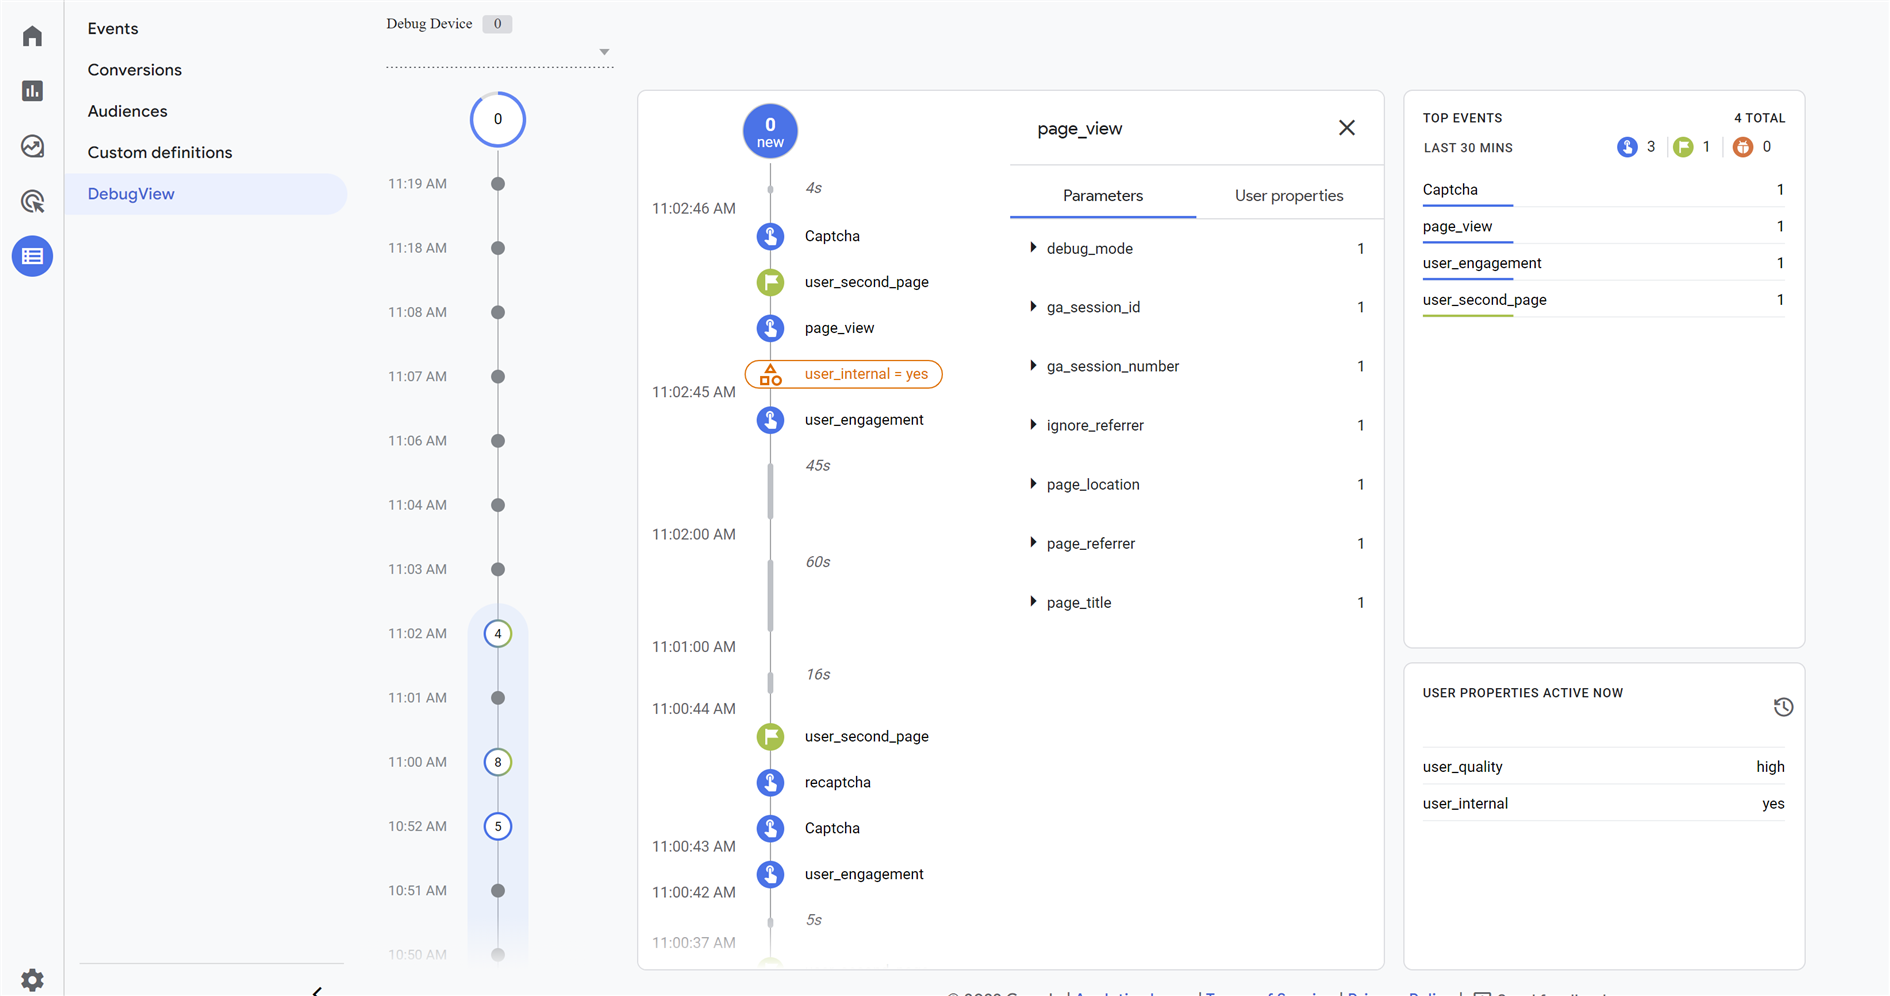
- DebugView
- Advertising Snapshot, Attribution Model
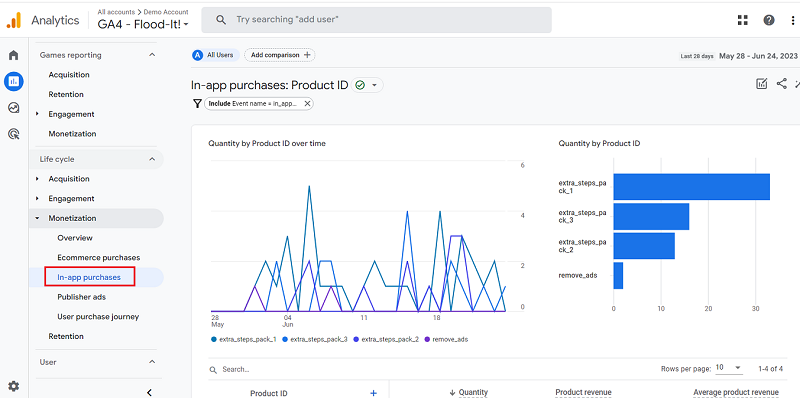
- Performance across All Channels, In-app Purchases
- Share Report & Schedule Report, Create & Manage Custom Insights
- Trail Blazers have made complete use of GA4 to maximize their business Revenue
- 1. Sephora
- 2. Spotify
- 3. Warby Parker
- 4. Marriott International
- 5. The New York Times
- Wrapping Up
With the blurring lines between online and offline, Google Analytics 4 (GA4) marks a paradigm shift compared to its predecessor, Universal Analytics (UA). Designed with a future-proof approach, GA4 prioritizes privacy, cross-platform tracking, and predictive insights, offering a 360-degree view of your users. When it comes to Universal Analytics going extinct, It is a matter of discussion, but the truth is, change is the only constant thing and the future is ready for one such change that is GA4!
Unlike UA, which relies heavily on session-based data, GA4 focuses on events and user interactions, providing a 74% more granular understanding of user behavior across websites and apps. This massive leap in data granularity empowers you to make data-driven decisions with unprecedented precision.
The introduction of Google Analytics 4 (GA4) represents a significant leap forward in google advanced data analytics, as businesses and marketers demand more sophisticated tools to navigate the complexities of digital engagement. The significance of GA4 over Universal Analytics lies in its ability to adapt to a cookie-less future and its focus on machine learning to fill in the gaps where data might be missing. This new Google analytics model not only respects user privacy but also ensures that businesses can continue to gain valuable insights in an ever-evolving digital landscape.
What are GA4 Advance Metrics?
Advanced metrics and data visualization are at the heart of GA4, providing unprecedented control and customization options. The launch of GA4 is particularly timely, as businesses and marketers seek more sophisticated web analytics services to navigate the complexities of digital engagement. The ability to dive deep into user behavior, segment audiences more effectively, and visualize data through customizable reports allows for informed decision-making.
In today’s data-driven world, the ability to quickly interpret complex datasets and turn them into actionable insights is crucial. GA4 empowers organizations to do just that, making it an indispensable tool for anyone looking to optimize their online presence and engage with their audience more effectively.
For professionals looking to deepen their understanding of this powerful tool, obtaining a google analytics 4 certification can be a game-changer. This certification, coupled with comprehensive google analytics 4 training and courses, equips marketers with the knowledge to effectively implement and leverage GA4’s advanced features.
Advanced metrics and data visualization are the cornerstones of GA4, offering unprecedented control and customization compared to previous analytics platforms. This translates into several key benefits:
- Deeper User Insights: GA4 empowers you to dive deep into user behavior, going beyond basic pageviews and sessions. You can track user interactions, events, and journeys across your website and app, providing a richer understanding of how users engage with your content.
- Enhanced Audience Segmentation: GA4’s robust segmentation capabilities allow you to slice and dice your audience data in more granular ways. This enables you to target specific user groups with laser precision, tailoring your marketing efforts for maximum impact.
- Customizable Reports & Visualizations: GA4’s flexible reporting and visualization tools allow you to transform complex data sets into clear and actionable insights. You can create custom reports and dashboards to track key metrics, identify trends, and uncover hidden patterns in your data.
Setting up GA4 can seem daunting at first, but with numerous google analytics 4 tutorials and a step-by-step ga4 setup guide, businesses can smoothly transition from Universal Analytics to GA4. The ga4 property configuration is a critical step in this process, laying the foundation for ga4 advanced tracking and analysis.
The ga4 transition is not just a technical update but a strategic move to harness the full potential of digital analytics. From ga4 reporting to understanding how to migrate ua to ga4, businesses are tasked with navigating new territories in data analytics. The Google Analytics event count feature, along with detailed website analytics reports, provides insights that were previously difficult to obtain.
The GA4 Revolution
Since the deprecation of Universal Analytics (UA), many companies across various industries have adopted Google Analytics 4 (GA4) to monitor their websites’ performance. This includes well-known brands like Twitter, Uber, and Netflix. IT companies, in particular, are finding GA4 valuable due to its ability to track user behavior across platforms and devices, providing crucial insights into the tech-savvy user journey.
Some of the leading IT companies that use GA4 and are seeing success include Nike, Slack, Cisco, WordPress, Figma, and Pearson. These companies are leveraging GA4’s advanced features to gain a deeper understanding of their users and optimize their online presence.
Beyond specific IT companies, the platform adoption stats for popular website-building platforms like:
Shopify
With almost 520,000 GA4 websites, highlighting the growing trend among E-Commerce businesses.
WordPress
Over 2 million GA4 websites, showcasing its widespread use even within non-IT focused websites.
GA4 Exploration
GA4 Exploration takes analytics to the next level by offering users unparalleled flexibility and depth in analyzing their data. This feature is a significant departure from the static, one-size-fits-all reports of Universal Analytics, offering a dynamic and interactive way to explore data. With Exploration, users can create custom reports that go beyond the surface level, delving into the nuances of user behavior and engagement.
One of the core advantages of GA4 Exploration is its user-friendly interface, designed to make complex data analysis accessible to users of all skill levels. Whether you’re a seasoned data scientist or a marketing professional looking to glean insights from your campaigns, Exploration offers a suite of tools to help you uncover the stories behind your data.
Integrating GA4 with existing tools, such as adding ga4 to google tag manager, simplifies the ga4 implementation guide. This integration streamlines the process of tracking custom events in google analytics 4 and managing google analytics 4 event parameters.
Exploration provides a variety of configuration options, including but not limited to, dimension and metric comparisons, cohort analysis, and user flow visualizations. These configurations can be adjusted and manipulated to suit specific analytical needs, allowing users to view their data from multiple angles and discover trends that might not be apparent from standard reports.
For instance, by utilizing the user flow visualization, businesses can track the journey of their customers through their website or app, identifying potential drop-off points or areas of high engagement. This can lead to targeted improvements in user experience and increased conversion rates. Similarly, cohort analysis can help businesses understand the long-term value of specific user segments, guiding more effective allocation of marketing resources.
To represent data effectively to teams or clients, it’s essential to focus on clarity and relevance. Start by identifying the key metrics that align with your business objectives, and use visualizations that clearly convey these metrics. Tailor your reports to the audience, ensuring that technical complexities are simplified for stakeholders who may not have a background in data analysis. Utilizing narrative storytelling techniques can also help in making your data more relatable and engaging, turning raw numbers into compelling stories of success, challenges, and opportunities.
Advanced Real-Time View
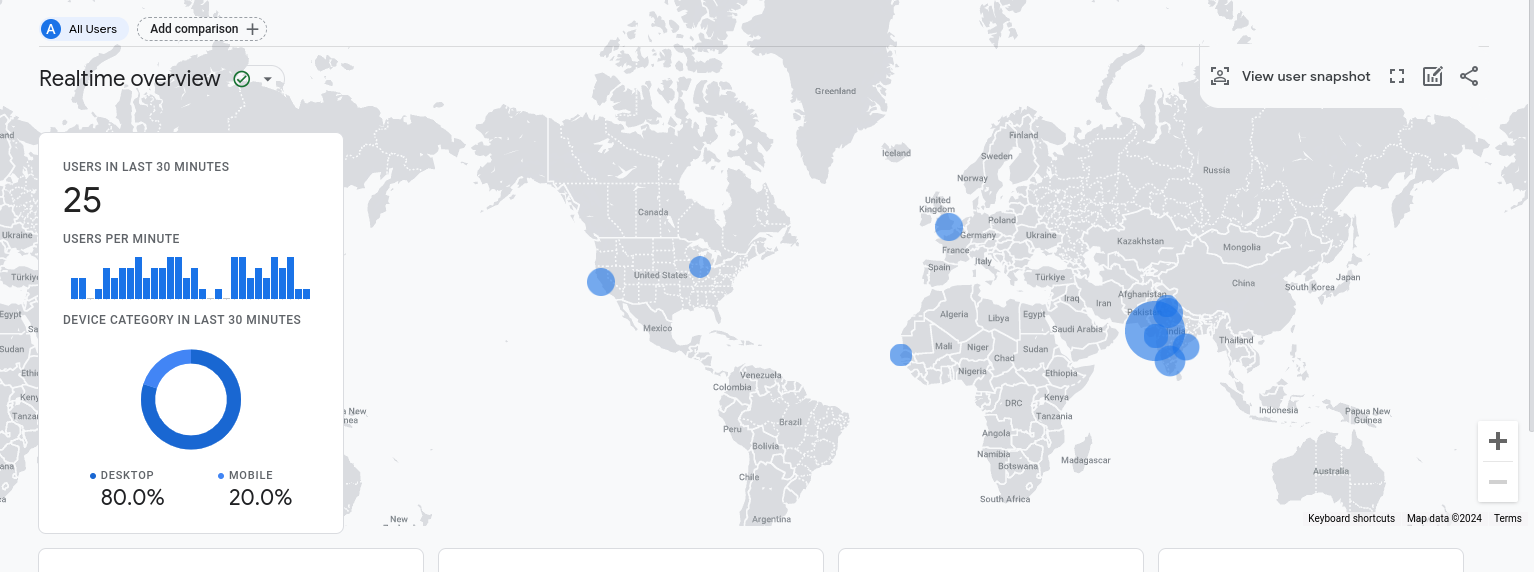
The Real-time report in Google Analytics 4 (GA4) is a dynamic feature designed to give marketers, analysts, and business owners immediate insights into what’s happening on their website or app at any given moment. This feature tracks and displays events and interactions that have occurred within the last 30 minutes, offering a snapshot of current user activity. Unlike its predecessor in Universal Analytics, the Real-Time report in GA4 is more detailed and provides deeper insights into user behavior.
The types of events and information that can be tracked in real-time include user interactions such as page views, button clicks, e-commerce transactions, and custom events that you define. Additionally, it provides information about the users’ devices, geographic locations, and the pages they are currently viewing. This immediate feedback allows for a quick understanding of how users are interacting with a site or application in real time.
One of the key benefits of the Realtime report is its ability to enhance user engagement analysis. By observing how users interact with new content, features, or marketing campaigns as they go live, businesses can quickly identify successful elements or pinpoint issues that need immediate attention. This instant feedback loop enables agile adjustments to content or strategy, maximizing engagement and improving user experience. For example, if a newly launched marketing campaign is driving significant traffic to a landing page, real-time data can help identify whether users are engaging as expected or bouncing off, allowing for quick optimizations.
Enhanced Measurement
Enhanced Measurement in GA4 marks a significant evolution in tracking user interactions on websites and apps with minimal effort. This feature automatically collects data on a variety of interactions, negating the need for manual code modifications to track specific events. The Enhanced Measurement is enabled by default when you set up a GA4 property, streamlining the data collection process and ensuring that valuable interactions are not missed. The automatically tracked events include:
- Page views (page_view): Tracks when a page is loaded or viewed.
- Scrolls (scroll): Captures when a user scrolls to the bottom of a page, indicating engagement.
- Outbound link clicks (click with parameter outbound: true): Tracks when a user clicks on a link leading away from your site.
- Site search (view_search_results): Monitors when a user performs a search on your site.
- Video engagement (video_start, video_progress, video_complete): Details how users interact with video content.
- File downloads (file_download): Tracks when a user downloads a file from your site.
- Form interactions (form_start, form_submit): Monitors when users start and submit forms.
Channel Groups
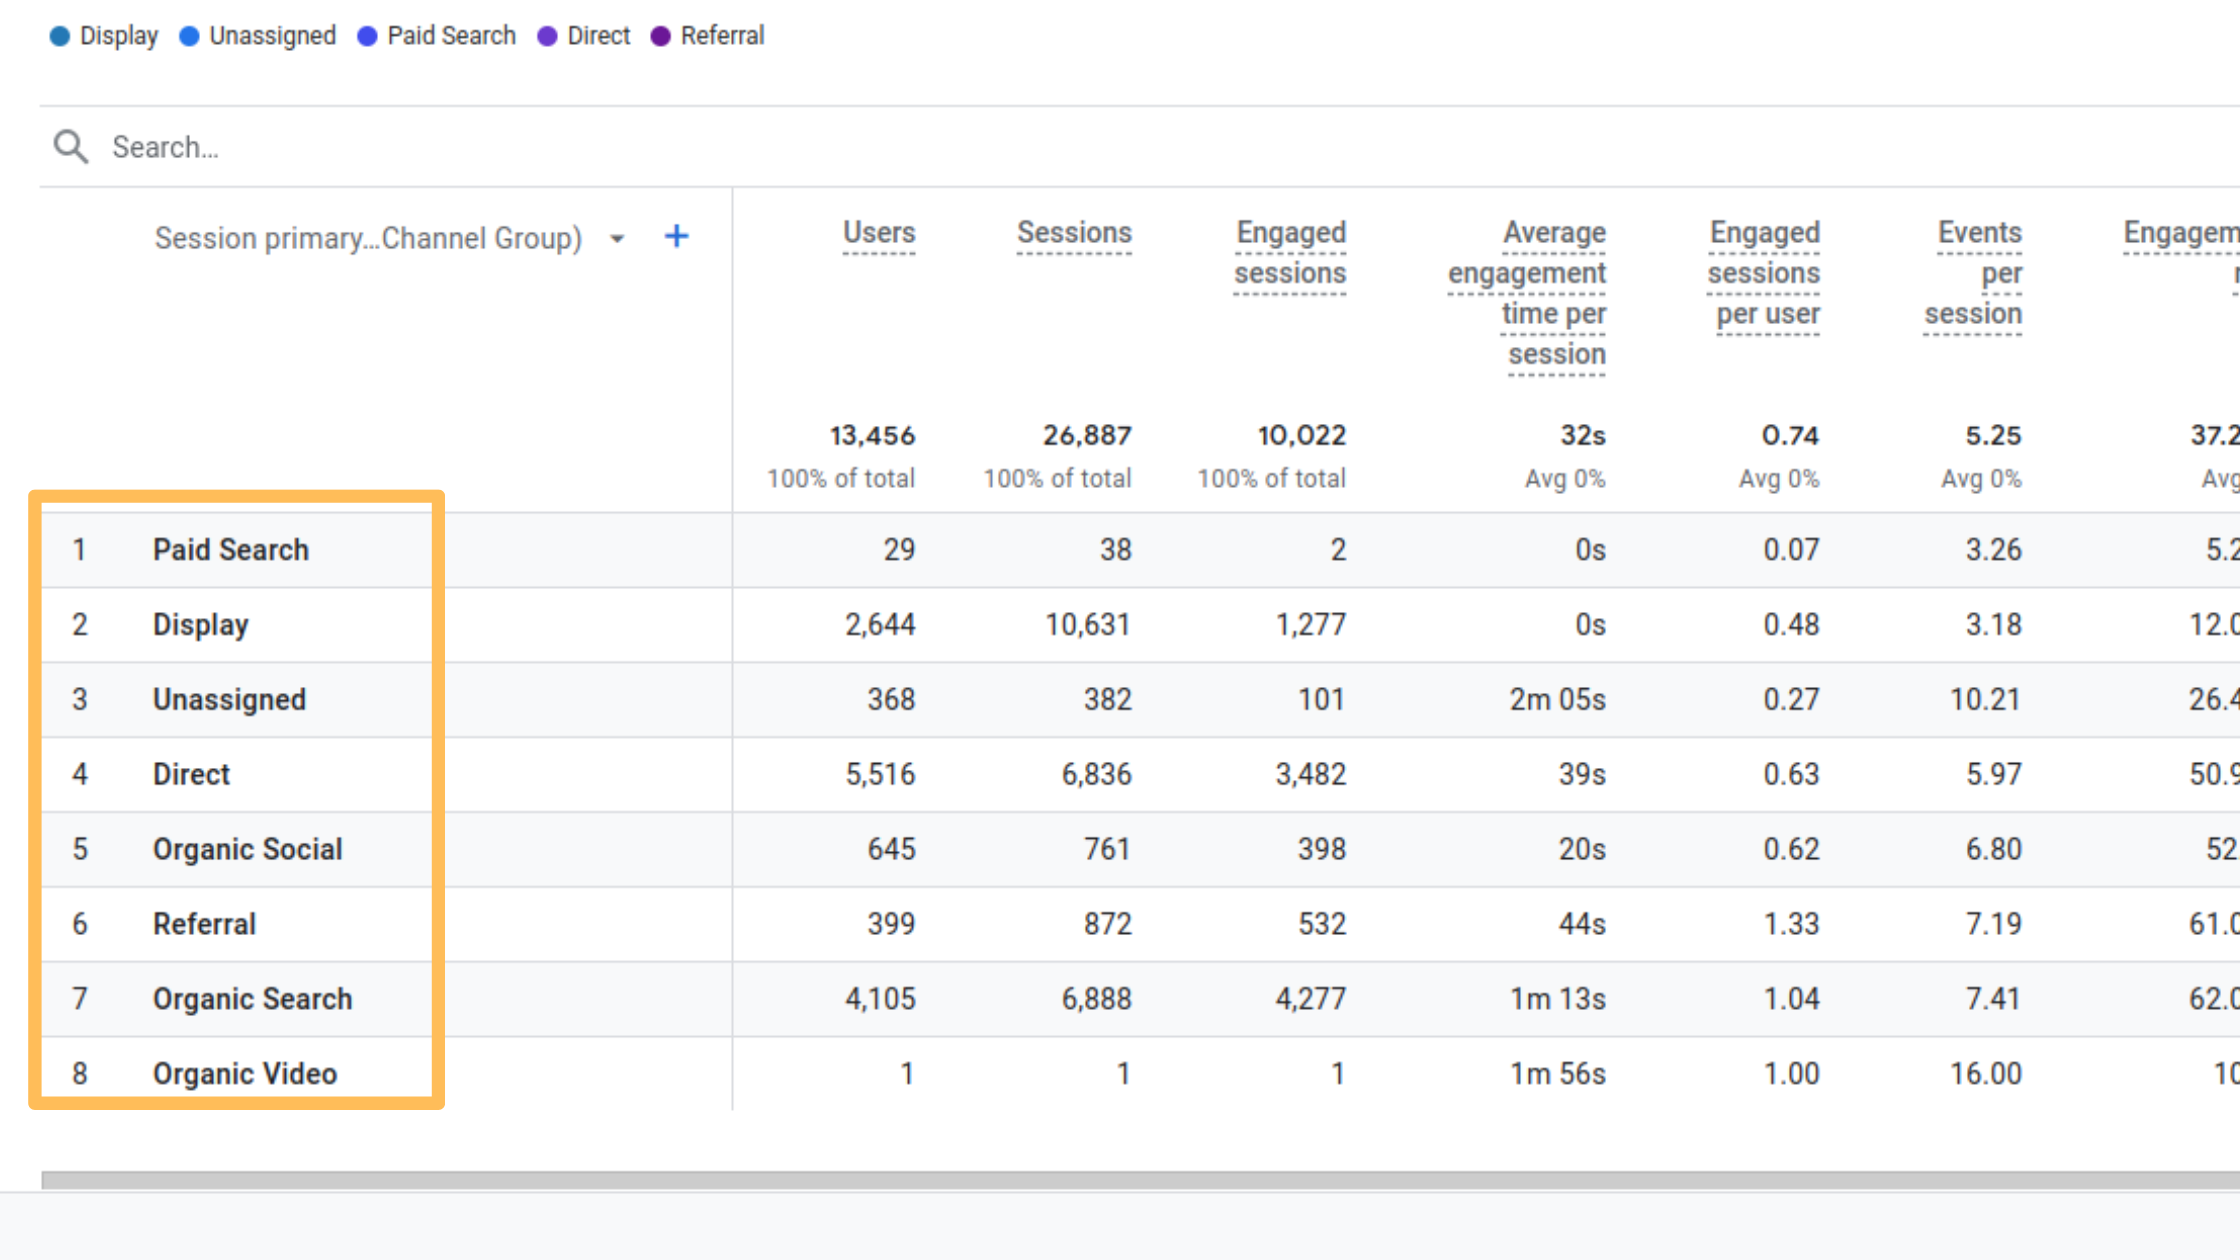
Channel Groups in GA4 are a powerful feature that allows businesses to categorize their traffic sources into meaningful segments, providing clearer insights into performance and user behavior. This customization feature goes beyond the default channel groupings by allowing you to create and define your own groups based on specific criteria, such as campaign names, source, medium, or any other dimension that suits your analysis needs.
Creating custom channel groupings offers several benefits, including the ability to tailor analysis to the unique aspects of your marketing strategy. For instance, if you run multiple paid advertising campaigns across different platforms, you can create separate channel groups for each campaign or platform. This granularity enables you to compare the effectiveness of different channels directly, assess ROI more accurately, and allocate your marketing budget more effectively.
For e-commerce platforms, enhanced ecommerce ga4 provides a comprehensive overview of customer interactions, from browsing to purchase. The ga4 attribution model and ga4 default channel grouping offer insights into how different marketing channels contribute to conversions, enabling more effective budget allocation.
Examples of custom channel applications for paid campaigns could include grouping all paid social media traffic under a “Paid Social” channel group, while traffic from search engine marketing efforts could be categorized under a “Paid Search” channel. This level of customization allows for a nuanced understanding of how different marketing channels contribute to overall goals, such as conversions, engagement, or brand awareness.
Imagine dividing your website traffic into different categories, like “paid ads”, “social media”, or “email marketing.” This is what Channel Groups in Google Analytics 4 (GA4) do! They make it easy to understand where your website visitors come from and which marketing channels are working best.
Channel Groups help businesses in two ways:
- See what works: They quickly show which marketing channels are bringing in the most customers and sales.
- Make better decisions: This information helps businesses decide where to invest their marketing budget for the best results.
Think of Channel Groups as a secret weapon for marketers using GA4, letting them get the most out of their digital campaigns!
Retention Report
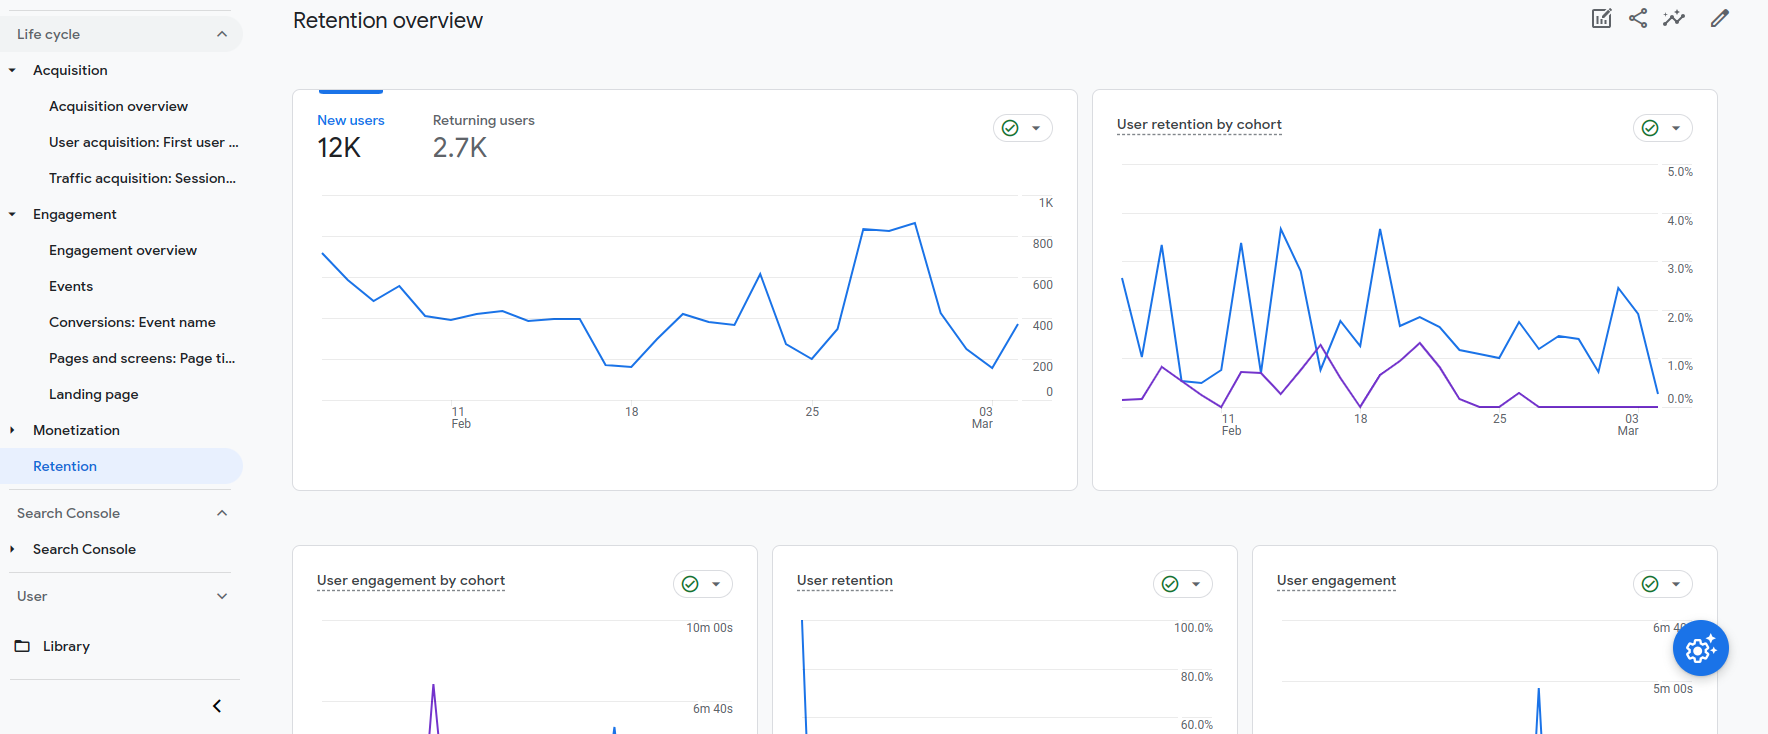
The Retention report in Google Analytics 4 (GA4) is an invaluable tool for understanding how effectively a business retains its users over time. This report tracks how many users return to your website or app after their initial visit, providing critical insights into user engagement and loyalty. The importance of the Retention report lies in its ability to measure the long-term value of users, which is crucial for evaluating the success of loyalty programs and customer re-engagement campaigns.
By analyzing retention data, businesses can identify which features or content keep users coming back and which areas may need improvement to increase user retention. For instance, high retention rates may indicate successful onboarding processes or effective loyalty programs, while low retention rates could highlight issues with user experience or product satisfaction.
To use the Retention report effectively, businesses should segment their audience based on different characteristics, such as acquisition source, user behavior, or demographics. This segmentation allows for a more detailed analysis of how different groups of users engage with the site or app over time. For example, you can assess the impact of a specific marketing campaign on user retention or determine whether users who engage with a particular feature are more likely to return.
Retention metrics can also inform cost per acquisition (CPA) strategies by highlighting the value of retaining existing users compared to acquiring new ones.
Retention metrics can help you decide how to spend your marketing budget:
- A high customer retention rate means your existing customers are happy and coming back.
- This suggests it might be more profitable to invest in keeping them happy (through good user experience or loyalty programs) than just focusing on getting new customers.
By understanding your retention metrics, you can:
- Balance your marketing budget: Spend money on both acquiring new customers and keeping existing ones happy.
- Maximize your overall profit: By keeping existing customers happy, you can save money and potentially earn more.
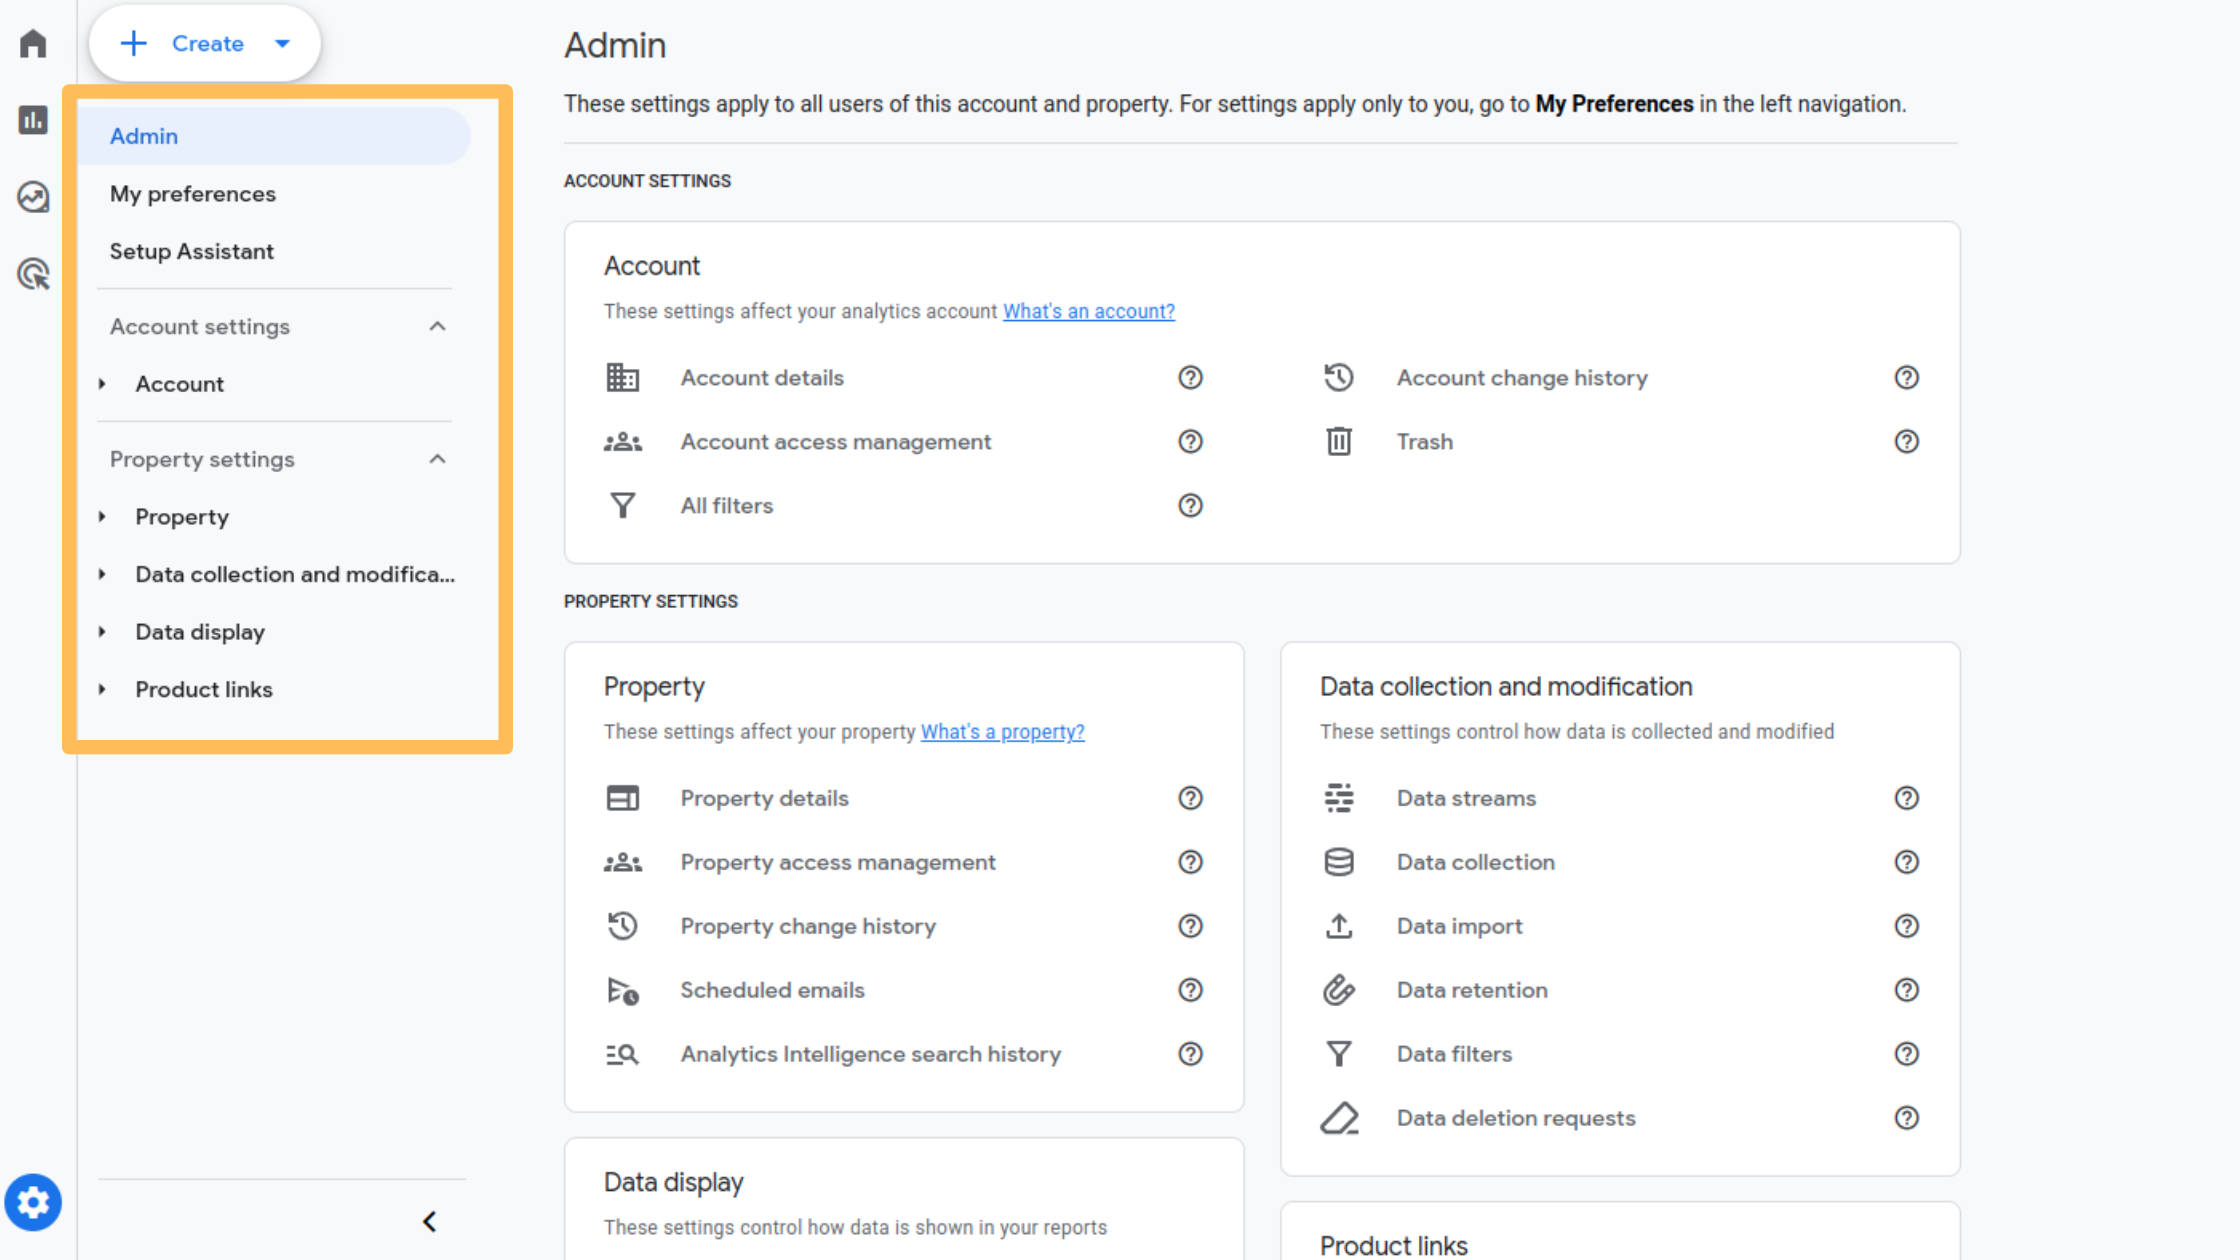
Admin Panel Options
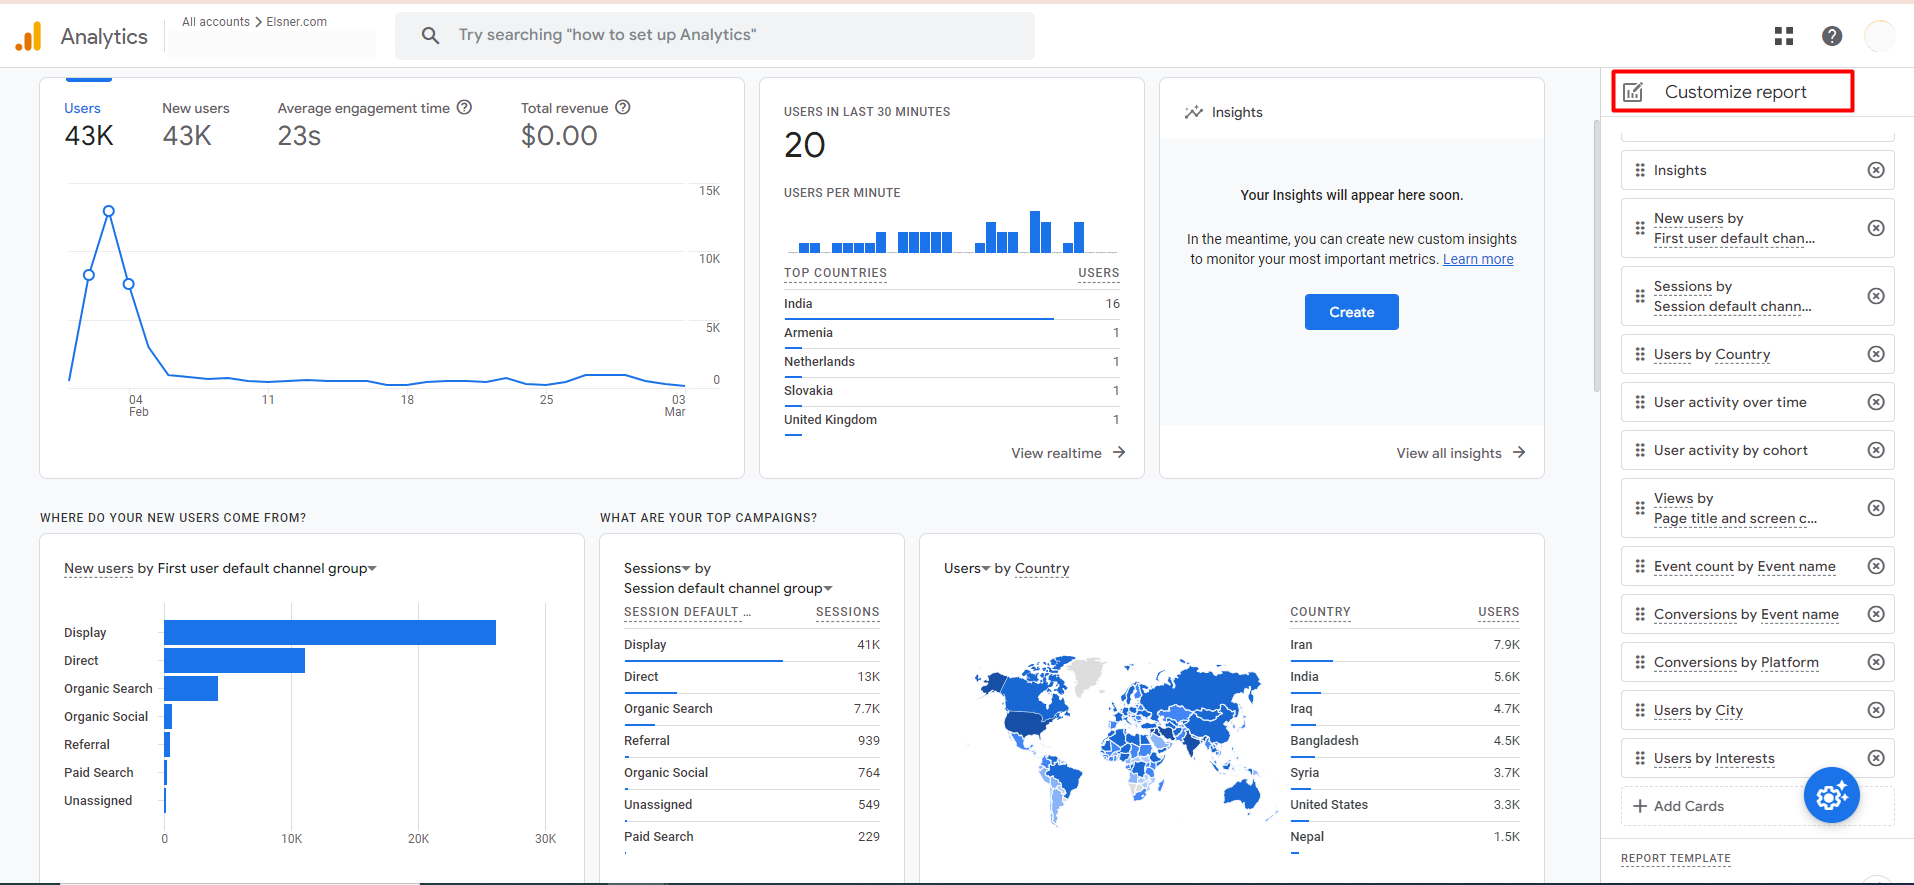
Customize Reports
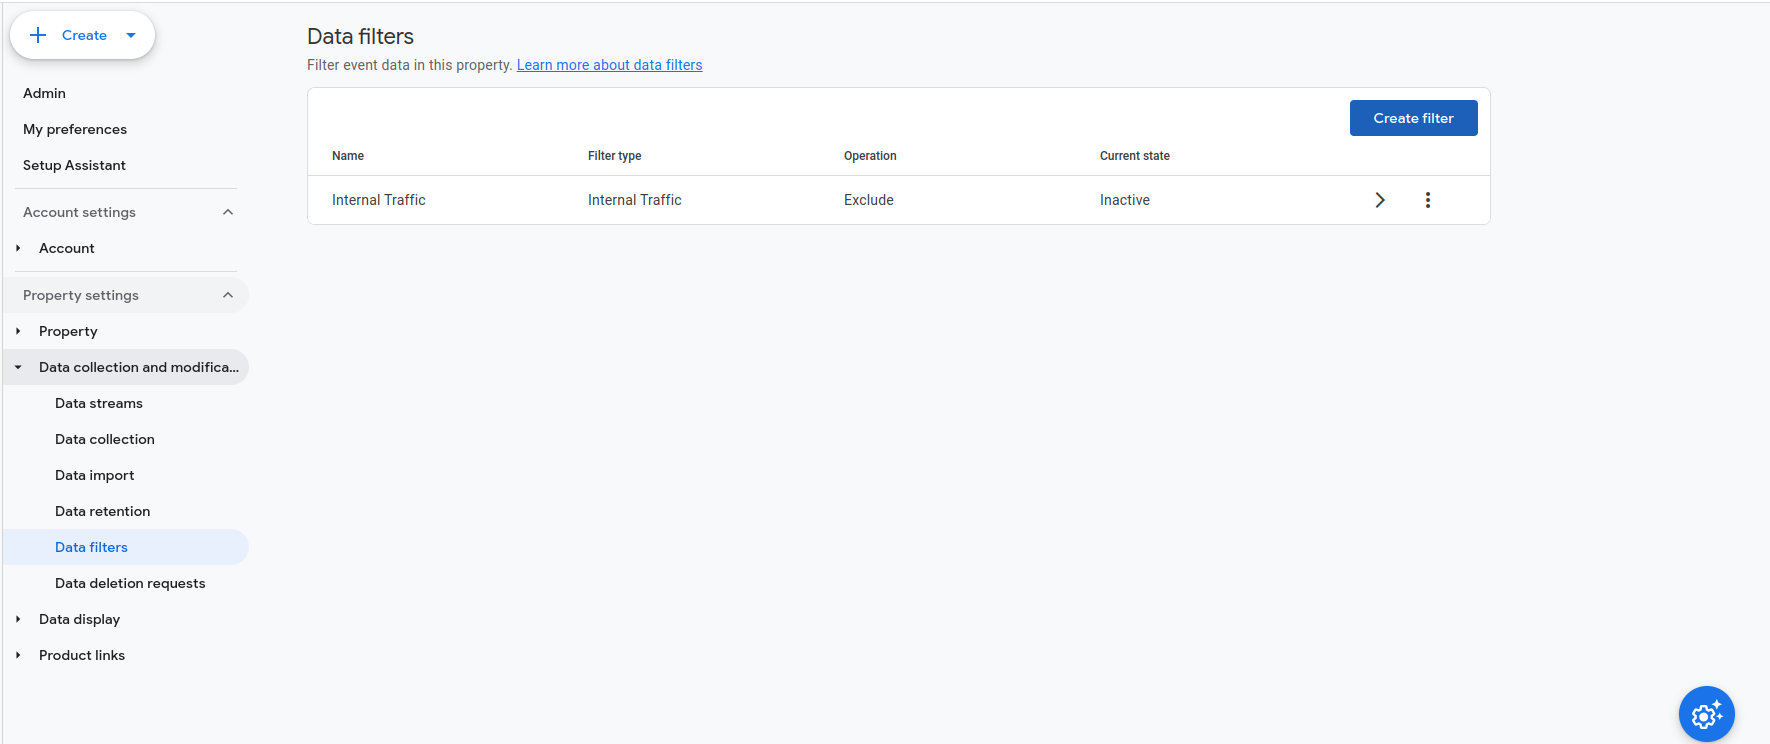
Data Filter
Setup Assistant
GA4 Setup AssistantGuides users through the setup process, ensuring that all necessary configurations are correctly implemented. This tool is invaluable for those transitioning from Universal Analytics to GA4.
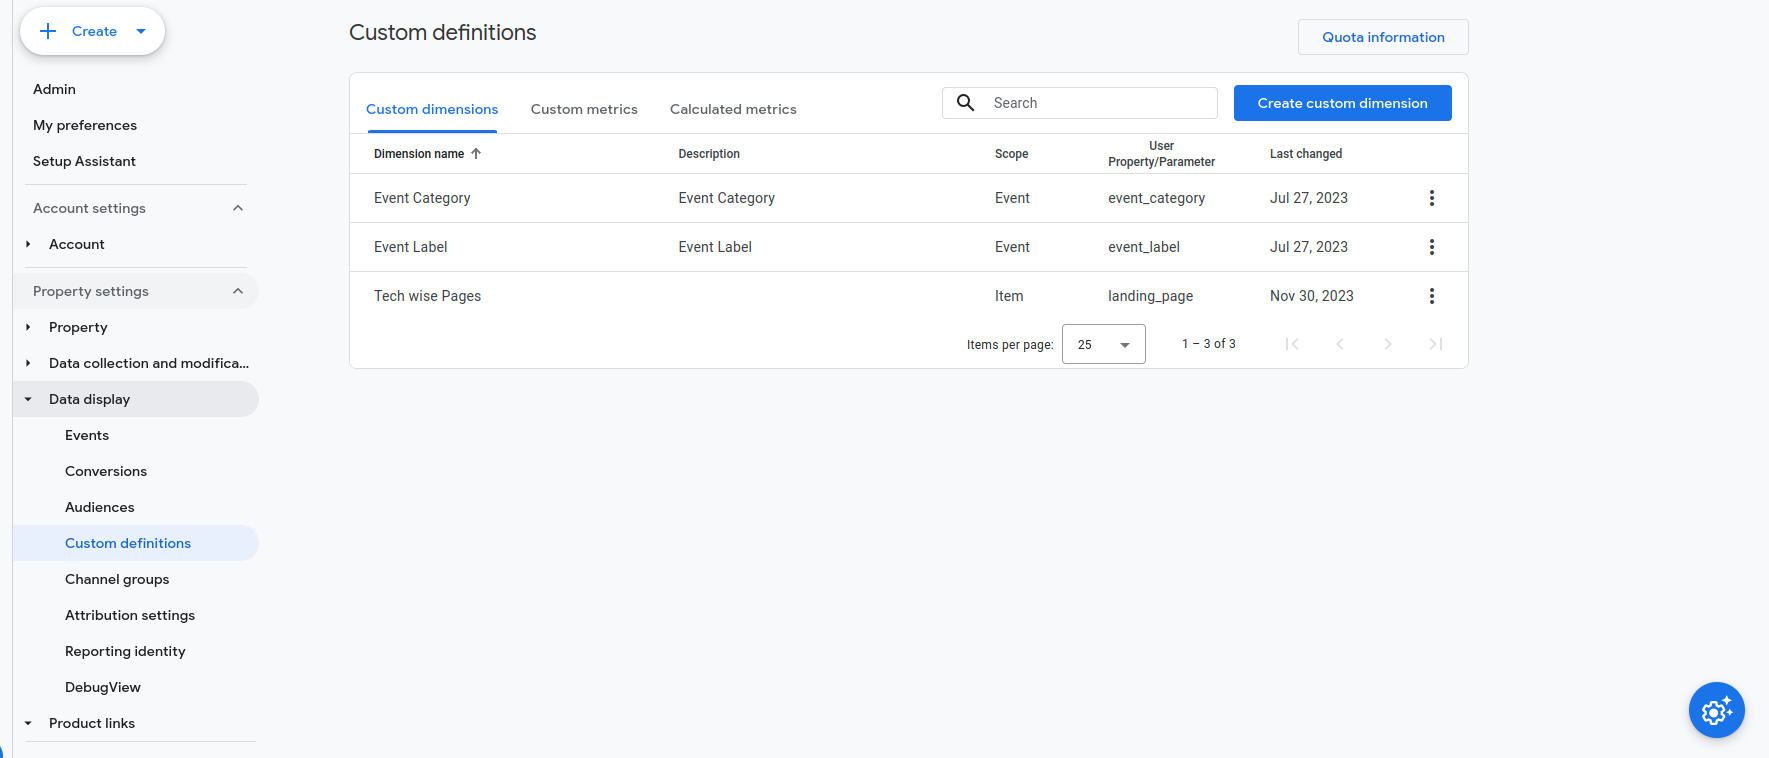
Custom Definitions
Data Display Options
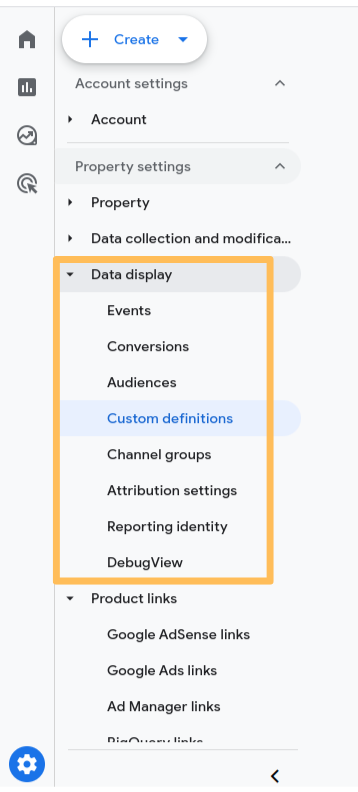
Events & Conversion, Audiences, Reporting Identity
Manage event tracking, set up conversion actions, create audience segments for targeted analysis, and define user identity across sessions for a unified view.
Search Console Integration
Link GA4 with Google Search Console to view search-related data directly within GA4, offering insights into organic search performance.
DebugView
Advertising Snapshot, Attribution Model
Analyze advertising performance and understand the contribution of different touchpoints in the conversion path, helping to allocate marketing spend more effectively.
Performance across All Channels, In-app Purchases
Share Report & Schedule Report, Create & Manage Custom Insights
Share insights with team members, schedule regular report deliveries, and create custom insights to highlight significant data trends or anomalies.
Trail Blazers have made complete use of GA4 to maximize their business Revenue
Google Analytics 4 (GA4) has emerged as a game-changer, offering businesses a powerful suite of tools for understanding user behavior and optimizing their online presence.
But how are companies actually using GA4 to achieve tangible results? Let’s explore the stories of trailblazers who have harnessed the full potential of this platform to maximize their business revenue:
1. Sephora
This beauty giant embraced GA4 early on, leveraging its advanced audience segmentation capabilities to personalize the customer experience. By analyzing user behavior, Sephora identified distinct customer segments and tailored marketing campaigns accordingly. This resulted in a 20% increase in click-through rates for their email campaigns and a 15% conversion rate increase for their personalized product recommendations.
2. Spotify
The popular music streaming service utilized GA4’s in-depth user journey tracking to understand how users interacted with different features on their platform. This allowed them to identify friction points and optimize the user experience. Additionally, Spotify employed GA4’s predictive modeling capabilities to forecast user churn and implement targeted retention strategies. These efforts led to a 10% reduction in churn rate and a significant increase in user engagement.
3. Warby Parker
The online eyewear retailer leveraged GA4’s cross-platform tracking to gain a holistic view of their customer journey, encompassing both their website and app. This enabled them to identify the most effective marketing channels for driving app downloads and in-app purchases. By analyzing user behavior on both platforms, Warby Parker was able to optimize their customer acquisition strategy, resulting in a 25% increase in app downloads and a 12% growth in average order value within the app.
4. Marriott International
The hospitality giant used GA4’s customizable reporting and dashboards to gain real-time insights into booking trends and guest behavior. This allowed them to dynamically adjust pricing strategies based on demand and personalize guest experiences across different touchpoints. By leveraging GA4’s data-driven insights, Marriott International achieved a 10% increase in average revenue per room and a significant improvement in guest satisfaction.
5. The New York Times
The renowned news organization utilized GA4’s engagement analytics to understand how users interacted with their content. This allowed them to identify the most popular articles and tailor content recommendations accordingly. Additionally, The New York Times employed GA4’s attribution modeling features to understand the impact of different marketing channels on subscription conversions. These efforts led to a 15% increase in subscriber acquisition and a 20% rise in engagement with premium content.These are just a few examples of how businesses are utilizing GA4 to unlock significant revenue growth. The common thread? These trailblazers recognized the power of data and used GA4 to understand their customers better, personalize experiences, optimize marketing strategies, and ultimately, drive tangible business results.
Wrapping Up
In today’s digital landscape, where understanding user behavior is paramount for success, leveraging the power of GA4’s advanced metrics and features is no longer optional, it’s essential.
Studies have shown that businesses utilizing GA4 experience a 20% increase in their ability to identify high-performing marketing channels, leading to more efficient budget allocation and maximized return on investment. Additionally, GA4’s real-time data capabilities allow businesses to respond to user behavior and market trends with unprecedented agility, providing a competitive advantage in the ever-evolving digital world.
The comprehensive suite of tools and reports offered by GA4, from Realtime views that track user activity as it happens, to in-depth Retention reports that reveal user loyalty patterns, empowers businesses to gain a 360-degree view of their digital presence. And the versatile Admin Panel options allow for customizing data collection and reporting to perfectly align with specific business needs.
The implementation of ga4 ecommerce tracking and the use of the ga4 setup assistant streamline the setup process, while ga4 data streams ensure real-time data flow. For businesses operating on platforms like Shopify, adding google analytics to shopify enhances the ability to track user interactions and conversions. GA4’s advanced features, from web analytic tool capabilities to detailed audience insights, represent a paradigm shift in digital analytics.
By experimenting with these features and unlocking the full potential of their data, businesses can refine their marketing strategies, enhance user experiences, and ultimately, achieve greater success in their digital endeavors. Ready to take your understanding of your audience to the next level? Explore the power of GA4 and unlock the valuable insights it holds for your business.

About Author
Pankaj Sakariya - Delivery Manager
Pankaj is a results-driven professional with a track record of successfully managing high-impact projects. His ability to balance client expectations with operational excellence makes him an invaluable asset. Pankaj is committed to ensuring smooth delivery and exceeding client expectations, with a strong focus on quality and team collaboration.


