




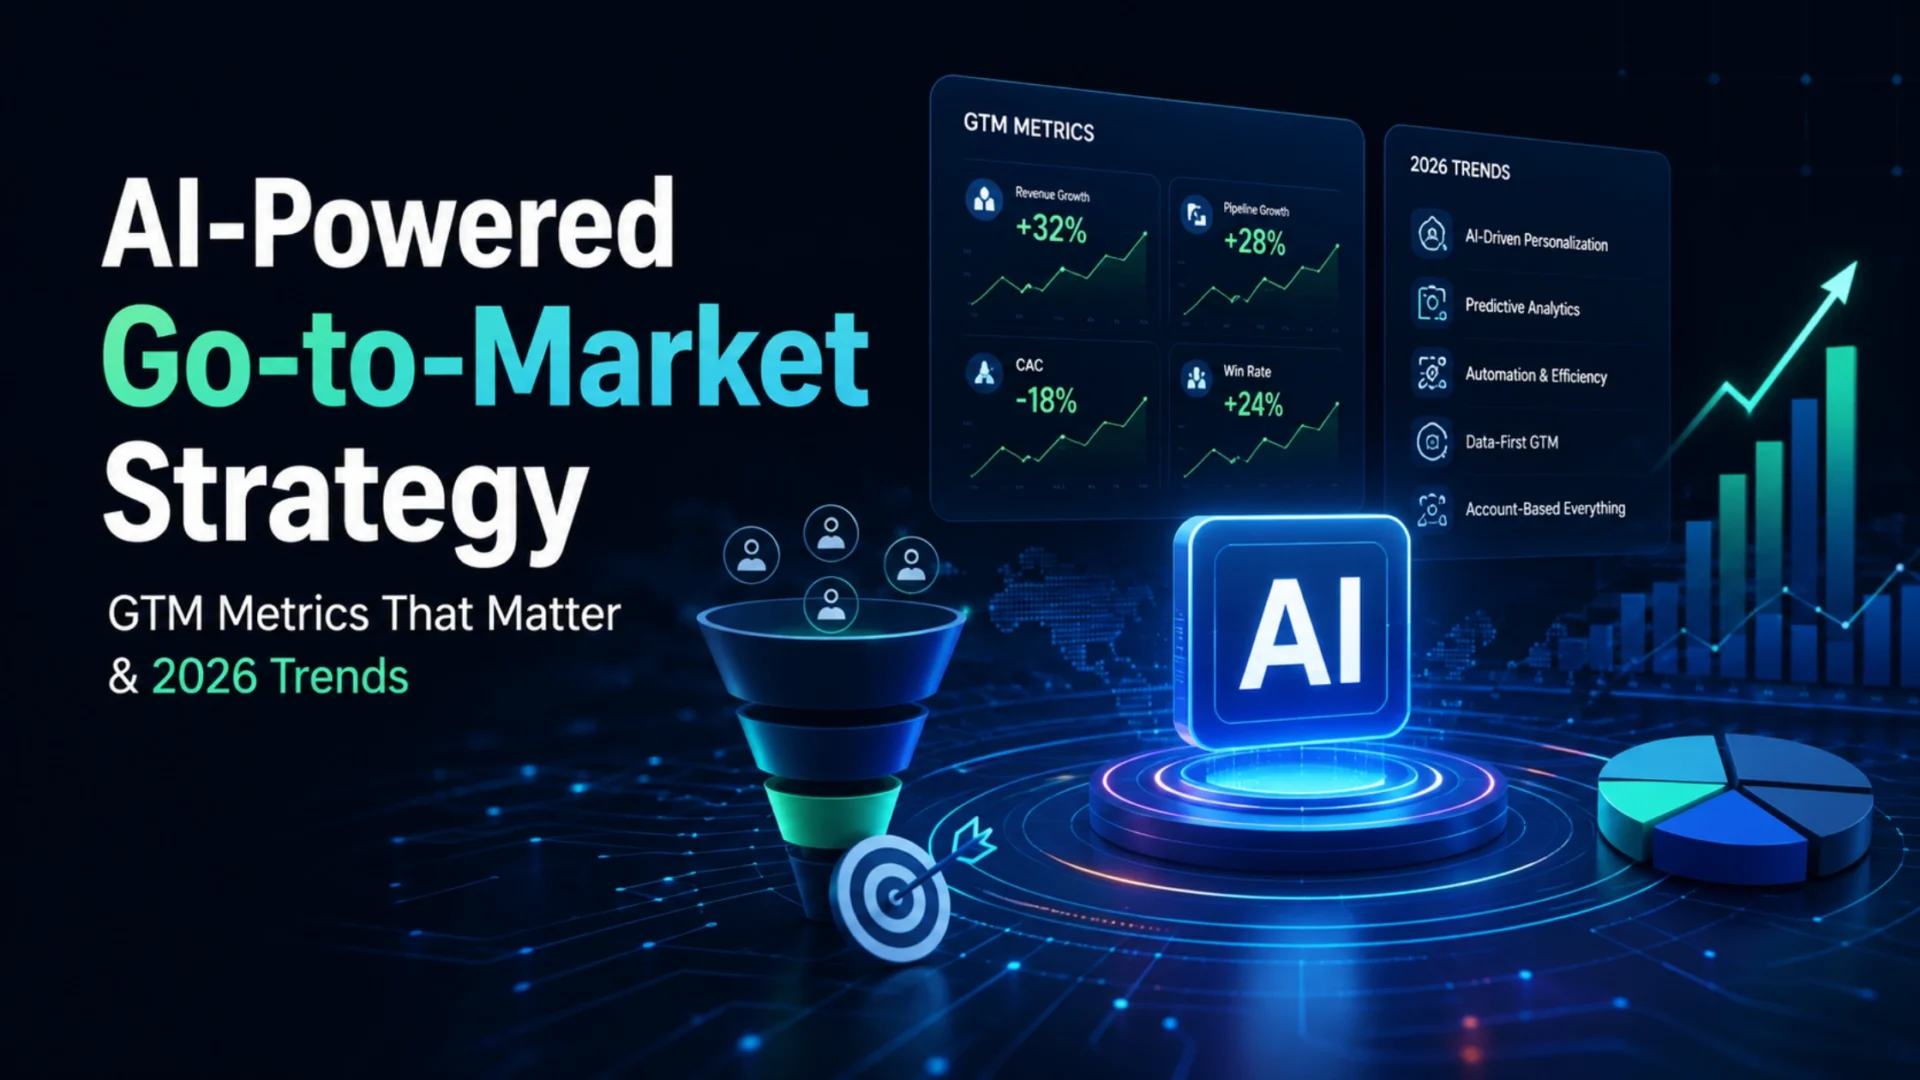
- What an AI-powered go-to-market strategy actually means
- Why most GTM dashboards are misleading you
- The GTM metrics that actually matter in 2026
- How AI changes the way you measure each metric
- GTM metrics by growth stage
- GTM metrics by motion: PLG vs sales-led vs ABM
- Building an AI-powered GTM engine: a 5-step framework
- The GTM trends actually shaping 2026, not just the ones getting hyped
- 1. Agentic execution is replacing task automation
- 2. The GTM engineer becomes a core hire, not an experiment
- 3. AI ROI gets measured against retention, not just cost savings
- 4. Self-serve stops being a top-of-funnel experiment
- 5. Buying committees force signal-based, multithreaded measurement
- Common mistakes companies make with AI-powered GTM metrics
- A real-world scenario
- How Elsner approaches AI-powered GTM measurement
- Key takeaways
- Ready to build a GTM engine that measures what actually matters?
- Frequently Asked Questions
- What is an AI-powered go-to-market strategy?
- Which GTM metrics matter most in 2026?
- How do you calculate pipeline velocity?
- What is a healthy CAC payback period in 2026?
- Does AI actually reduce customer acquisition cost?
- What is a GTM engineer, and do I need one?
- How is net revenue retention different from customer retention rate?
- Should every company aim for the same GTM benchmarks?
A Series B founder told us something last quarter that stuck. His team had eleven dashboards, three of them fed by AI tools, and not one person in the room could answer a simple question: is our go-to-market engine actually getting more efficient, or does it just look busier? That gap between activity and efficiency is exactly what’s breaking GTM strategy right now, and AI is making the gap louder, not quieter.
Every revenue team in 2026 says they’re running an AI-powered go-to-market strategy. Fewer of them can say which GTM metrics actually moved because of it. Pipeline coverage looks fine. MQL counts look fine. Meanwhile CAC creeps up, sales cycles stretch out, and nobody notices until a board member asks why the funnel that looks healthy on paper isn’t converting into revenue that shows up in the bank account.
This guide walks through what an AI-powered go-to-market strategy actually looks like once you strip away the buzzwords, which GTM metrics genuinely matter in 2026, how AI is changing the way each one gets measured, and where most companies quietly go wrong. We’ll also get into the five GTM trends actually reshaping revenue teams this year, from agentic execution to the rise of the GTM engineer, because those shifts affect which metrics your team should even be looking at.
Quick Answer
An AI-powered go-to-market strategy uses AI to automate research, scoring, personalization, and forecasting across the revenue funnel, but the strategy only works if it’s measured against the right GTM metrics. In 2026, that means moving past vanity numbers like raw lead volume and MQL count toward efficiency metrics: pipeline velocity, CAC payback period, net revenue retention, the Rule of 40, and a GTM efficiency ratio. Companies pairing AI adoption with disciplined metric tracking are seeing measurably shorter sales cycles and higher pipeline per rep. Companies adding AI tools without changing what they measure mostly just get faster vanity metrics.
What’s Covered
- What an AI-powered GTM strategy actually means
- Why most GTM dashboards are misleading you
- The GTM metrics that actually matter in 2026
- How AI changes the way you measure each metric
- GTM metrics by growth stage
- GTM metrics by motion: PLG vs sales-led vs ABM
- Building an AI-powered GTM engine: a 5-step framework
- 5 GTM trends actually shaping 2026
- Common mistakes companies make
- FAQs
What an AI-powered go-to-market strategy actually means
Strip away the marketing language and an AI-powered go-to-market strategy is really just this: using machine learning and generative AI to compress the time between a buying signal appearing and a rep, or a system, acting on it. That’s it. Everything else is implementation detail.
In practice, that shows up across four layers of the funnel. Intent and firmographic data get scored automatically instead of sitting in a spreadsheet someone updates once a month. Outreach gets personalized at a scale no human team could match by hand. Forecasting pulls from actual deal signals instead of a rep’s gut feeling on a Friday afternoon. And post-sale, renewal risk gets flagged weeks before a human would have noticed the account going quiet.
A useful distinction here: adding AI to your GTM stack is not the same thing as running an AI-powered GTM strategy. Plenty of teams bolted a chatbot onto their website or asked ChatGPT to write subject lines and called it done. That’s tooling, not strategy. A genuine AI GTM agent takes a defined input, like a list of target accounts, runs a sequence of actions such as research, scoring, and personalized outreach, and produces a measurable output, typically a qualified meeting, with very little human babysitting in between.
The adoption curve backs this up. Per Pavilion’s 2026 GTM Benchmark Report, B2B teams using AI agents inside their GTM workflow jumped from roughly a quarter of companies in 2024 to two thirds of companies by 2026, and the same report found teams doing it well generate meaningfully more pipeline per rep than teams still running manual outbound. That’s not a small productivity bump. It’s a structural shift in how revenue gets built, and it’s why the metrics conversation has to change alongside it.
Here’s what most articles on this topic skip entirely: AI doesn’t just make your existing GTM metrics move faster. It changes which metrics are even worth tracking. A funnel that used to rely on MQL volume as its north star now needs to account for AI-qualified signals that never touch a traditional form fill. If your reporting still treats a form submission as the only real signal of intent, you’re already missing a growing share of how deals actually start in 2026.
Why most GTM dashboards are misleading you
Here’s an uncomfortable pattern we see constantly. A company adds AI-powered lead scoring, sees MQL volume climb 40 percent in a quarter, and calls the initiative a win. Nobody asks the follow-up question. Did win rate improve? Did sales cycle length shrink? Did CAC actually drop? Usually the honest answer is no, or nobody bothered to check.
Vanity metrics survive because they’re easy to report and always go up. Website traffic, total leads, social followers, even total pipeline dollars without a win-rate context, all of these can look fantastic while the actual revenue engine quietly loses efficiency. Boards and CFOs have gotten sharper about spotting this. The question in 2026 board meetings isn’t “how much pipeline do you have.” It’s “what’s your GTM efficiency trendline, and how does AI actually move it.”
Part of the problem is structural. Most CRMs were built around single-contact, single-touch deal tracking, but mid-market and enterprise deals in 2026 typically involve three to seven stakeholders influencing the decision. A dashboard that only tracks one contact per opportunity is blind to the multithreading that actually determines whether a deal closes. Add AI-driven outreach into that same blind system, and you get faster activity against a measurement framework that was already incomplete.
The fix isn’t more dashboards. It’s fewer, better ones, built around metrics that actually predict revenue rather than metrics that are simply easy to pull, which is exactly the gap a proper business intelligence setup is meant to close.
The GTM metrics that actually matter in 2026
There are two tiers here, and the distinction matters. Foundational metrics tell you whether your funnel is healthy at a basic level. Operator-grade metrics tell you whether your GTM engine is actually efficient, which is the question investors and boards care about most in a tighter funding climate.
| Metric | What it tells you | 2026 healthy benchmark |
|---|---|---|
| Pipeline velocity | How fast qualified opportunities turn into closed revenue | Track the trend, not the absolute number; 10% quarter over quarter improvement is strong |
| CAC payback period | How many months it takes to recover acquisition cost through gross margin | Under 12 to 18 months; enterprise motions can stretch further if LTV is strong |
| LTV:CAC ratio | Whether your unit economics justify the spend to acquire a customer | 3:1 minimum, 4:1 or higher in growth stage |
| Net revenue retention | Whether existing customers are expanding faster than they’re churning | Above 100% is healthy, above 120% is best in class |
| Rule of 40 | Growth rate plus profit margin, a single number for sustainable growth | Above 40% combined score |
| GTM efficiency ratio | New ARR generated per dollar spent on sales and marketing | Above 0.75, meaning less than $1.35 spent per $1 of new ARR |
| Win rate | Percentage of qualified opportunities that actually close | 20 to 30% overall, 40%+ for well-qualified pipeline |
Benchmarks shift by industry, deal size, and motion. Treat these as directional, not gospel.
Pipeline velocity deserves a closer look because it’s arguably the most useful single number on this list. It’s calculated as the number of open opportunities, multiplied by average deal value, multiplied by win rate, divided by average sales cycle length in days. That formula bundles volume, value, conversion, and speed into one figure, which is exactly why it works better as a leading indicator than pipeline coverage alone ever did.
One thing worth flagging honestly: fixing your two biggest revenue leaks, whether that’s a weak qualification stage or a bloated sales cycle, tends to produce outsized gains in pipeline velocity rather than incremental ones. Artemis GTM’s 2026 benchmark data, drawn from audits across B2B SaaS companies, found that businesses fixing their top two leaks saw a median 3.2x improvement in pipeline velocity within 90 days. That’s a bigger lever than most teams realize sits right in front of them.
Worked example
Say you have 50 open opportunities, an average deal value of $40,000, a 25 percent win rate, and a 90-day sales cycle. Pipeline velocity works out to (50 x $40,000 x 0.25) divided by 90, or roughly $5,556 in expected revenue generated per day. Shave the cycle down to 70 days through better qualification, with everything else held constant, and that same pipeline is now worth about $7,143 a day. No new leads, no new reps, just a faster-moving funnel.
How AI changes the way you measure each metric
This is where most GTM content stops short. Everyone lists the metrics. Fewer people explain what actually changes about measuring them once AI enters the workflow, and the answer is more interesting than “everything gets faster.”
CAC gets harder to calculate honestly. When an AI agent handles research, personalization, and first-touch outreach that used to require three separate hires, your cost inputs change shape. Software spend rises, headcount spend can actually fall, and if your finance team is still allocating CAC the old way, you’ll either understate or overstate your real acquisition cost. Rebuild the CAC formula around your actual current cost stack, not last year’s org chart.
Pipeline velocity becomes a leading indicator instead of a lagging one. AI models that score accounts on real-time intent signals, not quarterly firmographic updates, mean you can spot velocity problems while a deal is still moving instead of after it’s already stalled. That’s a genuine structural improvement, not just a faster spreadsheet.
Win rate needs a new denominator. AI qualification tends to surface more borderline opportunities than a human SDR would have bothered logging. If you don’t separate AI-sourced pipeline from human-sourced pipeline in your win-rate reporting, a genuinely improving human-led motion can look like it’s underperforming simply because the denominator got bigger and noisier.
Net revenue retention gets a warning system. Predictive models can flag renewal risk based on product usage decline, support ticket sentiment, or a champion leaving the account, weeks before a human customer success manager would have noticed anything unusual. NRR itself doesn’t change as a formula, but the lead time you get before it drops absolutely does, and that lead time is often the difference between saving an account and losing it.
The GTM efficiency ratio needs AI spend baked in properly. A lot of companies bury AI tooling cost inside a general “software” line item instead of treating it as GTM spend. That understates your denominator and makes your efficiency ratio look artificially strong. Be honest about what AI actually costs, including the implementation and prompt engineering time nobody logs as a line item.
ZoomInfo’s State of AI in Sales and Marketing survey of more than 1,000 GTM professionals found that a team using AI at least weekly across their funnel saved roughly 12 hours per person, per week, and those same teams reported shorter deal cycles and higher win rates than teams using AI sporadically or not at all. That gap between weekly users and occasional users is worth sitting with, because it suggests the benefit isn’t really about having AI tools. It’s about actually building them into the weekly rhythm of the team, not treating them as an occasional experiment.
GTM metrics by growth stage
Not every metric matters equally at every stage, and tracking Rule of 40 at a pre-launch startup is about as useful as tracking problem-solution fit at a company doing $200 million in ARR. Match your dashboard to where the business actually is.
| Stage | Primary metrics | Where AI helps most |
|---|---|---|
| Pre-launch | Problem-solution fit score, ICP validation rate | Analyzing early customer interviews and support tickets to surface real ICP signal, not assumed personas |
| Launch | Pipeline velocity, stage-to-stage conversion, CAC | Real-time account scoring so a small team punches above its headcount |
| Growth | LTV:CAC, net revenue retention, win rate | Predictive churn flags and AI-assisted forecasting that tightens accuracy |
| Scale | Magic number, burn multiple, Rule of 40 | Cross-functional data unification so finance, sales, and marketing trust one number |
Board-level reporting deserves its own note here. Six to eight metrics maximum, presented as trend lines across at least four quarters, not point-in-time snapshots. Boards don’t need to see MQL counts or channel-level activity data. They need to know whether the engine is creating more value than it consumes, and whether that trend is moving in the right direction.
GTM metrics by motion: PLG vs sales-led vs ABM
A metric that looks alarming in one motion can be perfectly normal in another. Comparing a product-led growth company’s conversion rate against an enterprise sales-led team’s conversion rate is comparing two different sports.
| Motion | Conversion benchmark | Retention profile |
|---|---|---|
| Product-led growth | Free-to-paid conversion of 5 to 9%, PQL conversion of 20 to 39% | Faster growth, typically lighter expansion revenue than sales-led |
| Sales-led | Lead-to-close of 1 to 5%, demo booking above 20% | Net revenue retention of 110% or higher through structured expansion |
| Account-based (ABM) | Fewer accounts, deeper multithreading across 3 to 7 stakeholders | Highest ACV, slower cycle, strongest long-term LTV when executed well |
Something worth noting for anyone leaning heavily bottom-up: ICONIQ’s State of Go-to-Market 2026 report found that high-growth companies are now projecting self-serve revenue closer to 20 percent of total ARR, roughly double what slower-growing peers expect. That’s a real signal that PLG isn’t just a top-of-funnel experiment anymore for the companies pulling ahead. It’s becoming a genuine revenue lever, not a nice-to-have acquisition channel bolted onto a sales-led core.
Most companies, honestly, run a blend rather than a pure motion. That’s fine, and often smarter. Just make sure your metrics dashboard segments by motion instead of averaging everything into one blended number that flatters nobody and informs nobody.
Building an AI-powered GTM engine: a 5-step framework
Skip the tool-shopping instinct. Most failed AI GTM initiatives start with “which AI tool should we buy” instead of “what’s actually broken in our funnel.” Fix the order and the rest gets easier.
Step 1: Audit your data foundation first. An AI model only reasons over the data it’s given, and most of what actually matters about an account, the calls, the emails, the intent signals, the exec changes, never makes it into the CRM in a usable form. Fix data hygiene and integration before layering AI on top, or you’ll just automate bad decisions faster.
Step 2: Rebuild your ICP as a living model, not a static slide. Basic firmographics like company size and industry aren’t enough anymore. A working ICP in 2026 blends behavior, buying signals, and outcomes from your best existing customers, refreshed continuously rather than revisited once a year in a planning offsite. If your ICP work is still stuck at the assumption stage, this is usually where product strategy consulting earns its keep, well before any AI layer gets added on top of it.
Step 3: Pick two or three metrics to rebuild around AI, not twenty. Trying to instrument your entire funnel with AI at once is how projects stall for a year and deliver nothing. Start with CAC payback and pipeline velocity if you’re growth stage, or NRR and churn prediction if retention is your bigger leak.
Step 4: Assign a human owner to every automated workflow. Guardrails matter here, and so does judgment. AI should suggest next steps to a rep or flag renewal risk to a CSM, not silently make the call on its own. The best GTM teams treat AI as a copilot scanning patterns and automating admin work, not as a replacement for the operator steering the deal.
Step 5: Review the numbers on a cadence that matches their volatility. Real-time dashboards for leading indicators like pipeline and qualified volume. Weekly reviews for funnel pacing. Monthly for CAC payback and retention. Quarterly for Rule of 40 and board-level reporting. Reviewing a lagging metric daily just creates noise and panic over normal week-to-week variance.
If GTM sits inside a broader modernization push at your company, this is usually the point where predictive analytics and forecasting infrastructure need to get built out alongside the metrics themselves, since a dashboard is only as good as the model feeding it.
Trying to Connect AI Tools to Actual Revenue Numbers?
A lot of companies have the AI tools already. What’s missing is the data pipeline and dashboard logic that turns raw usage into metrics leadership can actually trust.
| Custom AI agent development wired into your existing CRM and data stack |
| Business intelligence dashboards built around the metrics your board actually asks about |
| Ongoing support so the system stays accurate as your GTM motion evolves |
The GTM trends actually shaping 2026, not just the ones getting hyped
A lot of “2026 trend” content is really just last year’s trend with a new coat of paint. These five are different. Each one is already changing which GTM metrics matter and how they get measured, and none of them are going away once the novelty wears off.
1. Agentic execution is replacing task automation
There’s a real difference between automating a task and deploying an agent that executes a workflow end to end. Automating a task means a tool writes a subject line for you. An agent takes a list of target accounts, runs research, personalization, outreach, and follow-up, and hands you a qualified meeting with almost no human touch in between. That second version is what’s spreading fast through B2B GTM teams right now, and it’s the reason pipeline-per-rep numbers are climbing at the companies that have actually built it properly.
2. The GTM engineer becomes a core hire, not an experiment
The GTM engineer role barely existed two years ago. Hiring platforms tracking B2B job postings show the title going from a few dozen openings in early 2024 to well over three thousand by early 2026, a growth curve that outpaced even DevOps engineering during its early adoption years. The role exists because reps were drowning in a stack of roughly ten disconnected tools, and someone needed to architect how signals, scoring, personalization, and outreach actually connect instead of living in separate silos nobody looks at together.
Frankly, this changes what “GTM metrics” even means for a growing share of teams. A GTM engineer isn’t judged primarily on MQLs anymore. They’re judged on whether the automated workflows they built actually reduce CAC, shorten time to first revenue, and hold up as pipeline scales. That’s a systems-level metric set, closer to how an engineering team measures uptime and deploy frequency than how a traditional marketing team measures campaign performance.
3. AI ROI gets measured against retention, not just cost savings
Early AI adoption in GTM got justified almost entirely on cost savings and rep productivity. That’s shifting. Boards and investors are increasingly asking how AI investment shows up in net revenue retention and account expansion, not just how many hours it saved a sales team last quarter. That’s a healthier way to judge AI spend, honestly, since a tool that saves ten hours a week but does nothing for churn or expansion isn’t really moving the number that determines long-term company value.
4. Self-serve stops being a top-of-funnel experiment
We touched on the self-serve number earlier, but the trend worth flagging here is who’s adopting it. This isn’t a PLG-company thing anymore. Plenty of traditionally sales-led businesses are quietly building a self-serve tier underneath their enterprise motion, and the GTM metrics for that tier need their own dashboard, not a footnote on the sales-led one.
5. Buying committees force signal-based, multithreaded measurement
Mid-market and enterprise deals now typically involve three to seven stakeholders, and a GTM system that still tracks one contact per opportunity is measuring half the deal at best. The trend here is toward signal-based tracking across every stakeholder in a buying committee, not just the champion who filled out the demo request. Expect this to keep pushing CRMs and reporting tools to rebuild around account-level signals instead of contact-level ones.
Worth a caveat across all five of these. Most GTM teams genuinely aren’t ready for fully autonomous agentic workflows yet, and that’s fine. What separates the companies pulling ahead isn’t how advanced their AI stack looks on a slide. It’s how solid their process foundation is underneath it. Agentic AI amplifies a good process. It also amplifies a broken one, just faster and with a bigger bill attached. For companies exploring where conversational AI fits into this shift, particularly for support and mid-funnel engagement, our work in conversational AI and chatbot development usually starts with exactly this question: which workflow is actually worth automating first, based on where the real revenue leak sits.
Common mistakes companies make with AI-powered GTM metrics
Measuring AI adoption instead of AI impact
Tracking how many reps logged into the AI tool this week tells you almost nothing about revenue. Track whether CAC, sales cycle length, or win rate actually moved because of it. Adoption without impact is just a new line item on the software budget.
Chasing pipeline coverage instead of pipeline velocity
A 4x pipeline coverage ratio looks reassuring on a slide. It says nothing about how fast that pipeline actually converts. Velocity captures speed and conversion together. Coverage captures neither.
Letting AI spend hide inside a general software budget
If your GTM efficiency ratio doesn’t account for the real cost of the AI tools and the time spent tuning them, the number is flattering you. Be honest about the full cost stack before reporting an efficiency win.
Skipping the human correction layer on AI outreach
Fully autonomous AI SDR outreach without a human review step tends to produce faster activity and worse reputation, especially once deliverability and reply-rate signals catch up to generic, unreviewed messaging. Keep a human checkpoint until trust in the system is earned, not assumed.
Reporting one blended metric across every motion
Averaging PLG conversion rates with enterprise ABM conversion rates produces a number that misrepresents both. Segment your dashboards by motion, then roll up to a company-level view only after the segmented data makes sense on its own.
A real-world scenario
Picture a B2B SaaS company at $18 million ARR, growing steadily but watching CAC creep upward for three straight quarters. Their sales cycle sat at 95 days, win rate hovered around 22 percent, and leadership assumed the fix was simply hiring more SDRs.
The diagnosis. A quick audit found the real problem wasn’t lead volume. It was qualification. Roughly 60 percent of “qualified” pipeline was getting logged by a single junior SDR using outdated firmographic criteria, and deals were dying quietly at the demo stage because they were never a fit to begin with.
The intervention. Instead of hiring, the team rebuilt their ICP scoring model using actual closed-won account data, layered in an AI qualification agent to score inbound leads against that refreshed model, and gave reps a weekly dashboard built around pipeline velocity instead of raw lead count.
The outcome. Within one quarter, win rate climbed to 34 percent, sales cycle length dropped by roughly three weeks, and CAC payback shortened from 15 months to just under 10. No new headcount was added. The fix wasn’t more activity. It was pointing the existing activity at the right accounts and finally measuring the thing that predicted revenue instead of the thing that was easiest to report.
How Elsner approaches AI-powered GTM measurement
Our starting point is never a tool recommendation. It’s a conversation about which two or three numbers, if they moved, would actually change how your business is valued or how confidently your board sleeps at night. Most of the time that turns out to be CAC payback, pipeline velocity, or net revenue retention, not the twenty metrics currently living across six disconnected dashboards.
From there, our work typically spans business intelligence dashboard builds that unify CRM, product usage, and financial data into one trusted source of truth, along with custom AI agent development for the specific workflow that’s actually leaking revenue, whether that’s account scoring, churn prediction, or forecasting accuracy.
Positioning and ICP work usually come first, since automating a poorly defined ICP just produces bad decisions at higher speed. Once that foundation is solid, forecasting accuracy is where a validated model against your actual historical deal data, not a generic template, tends to matter most.
Key takeaways
An AI-powered go-to-market strategy isn’t defined by which tools sit in your stack. It’s defined by whether the right GTM metrics actually move because of them. Pipeline velocity, CAC payback, LTV:CAC, net revenue retention, and the Rule of 40 matter more in 2026 than raw lead volume or MQL count ever did, and AI changes how each one gets measured, not just how fast it gets reported.
The companies pulling ahead this year aren’t necessarily the ones with the most advanced AI stack. They’re the ones who fixed their data foundation first, picked a small number of metrics worth building automation around, and kept a human owner accountable for every automated decision along the way. Everyone else is just generating faster vanity metrics and calling it transformation.
Audit your current dashboard honestly before adding another AI tool to it. The goal was never more data. It was always a clearer answer to one simple question: is the engine actually getting more efficient.
Ready to build a GTM engine that measures what actually matters?
Talk to a team that audits your current data foundation, identifies the two or three metrics worth building AI around, and helps you architect a system your board can actually trust.
Frequently Asked Questions
What is an AI-powered go-to-market strategy?
An AI-powered go-to-market strategy uses machine learning and generative AI to automate research, lead scoring, personalization, forecasting, and renewal risk detection across the revenue funnel. The goal is compressing the time between a buying signal appearing and a rep or system acting on it, measured against real GTM metrics rather than tool adoption alone.
Which GTM metrics matter most in 2026?
Pipeline velocity, CAC payback period, LTV:CAC ratio, net revenue retention, the Rule of 40, and a GTM efficiency ratio are the metrics operator-grade teams track in 2026. These replace older vanity benchmarks like total lead volume or raw MQL count, which don’t reliably predict revenue on their own.
How do you calculate pipeline velocity?
Pipeline velocity equals the number of open opportunities multiplied by average deal value multiplied by win rate, divided by average sales cycle length in days. It’s considered the single most useful leading indicator of GTM health because it bundles volume, value, conversion, and speed into one number.
What is a healthy CAC payback period in 2026?
Under 12 months is considered excellent for most B2B SaaS companies, and under 18 months is generally acceptable. Enterprise motions with high lifetime value and strong gross margins can sustain a longer payback period without it signaling a problem.
Does AI actually reduce customer acquisition cost?
It can, but only when it’s paired with better qualification, not just faster outreach volume. Teams using AI consistently across their funnel report shorter deal cycles and higher win rates, both of which push CAC down indirectly. Simply adding an AI tool without changing qualification criteria often just produces faster activity against the same conversion problem.
What is a GTM engineer, and do I need one?
A GTM engineer builds and manages the automated workflows and AI agents that run outreach, scoring, and research across the funnel, treating go-to-market with the same rigor as a software system. Companies with a fragmented tool stack and manual, repetitive outbound processes typically benefit most from hiring or contracting one.
How is net revenue retention different from customer retention rate?
Customer retention rate only tracks whether a customer stayed. Net revenue retention tracks the dollar value of your existing customer base over time, including expansion, downgrades, and churn combined. A company can retain 95 percent of its customers by count while still shrinking revenue if the accounts that left were large ones, which is exactly why NRR is the more predictive metric of the two.
Should every company aim for the same GTM benchmarks?
No. Benchmarks shift meaningfully by motion, deal size, and industry. A product-led growth company’s conversion rates will look nothing like an enterprise account-based motion’s, and comparing them directly usually leads to the wrong conclusion. Segment your metrics by motion before comparing them against any external benchmark.